Analysing yoUSD: Disciplined Yield Generation in Practice
Introduction
The recent collapse of Stream Finance's xUSD stablecoin in November 2025 offers a stark reminder of what happens when yield strategies prioritise returns over transparency. After an external asset manager lost $93 million in undisclosed positions, the protocol's failure followed a familiar pattern: opaque strategies, unverifiable yields, and risk controls that existed only in marketing materials.
Such failures raise a fundamental question for allocators: does rigorous risk management require sacrificing returns? If strategies like xUSD represent the cost of chasing yield without discipline, what performance can allocators reasonably expect from strategies that meet higher due diligence standards?
This analysis examines six months of performance data from yoUSD, a yield optimiser that operates with transparent mechanics and verifiable allocations, benchmarked against the Stablecoin Prime Rate (SPR). The data suggest that disciplined strategies can deliver attractive returns without the opacity that often precedes collapse.
Background and Methodology
YO Protocol operates as a non-custodial yield optimiser that automatically reallocates deposits across vetted DeFi protocols. The protocol's documentation shows integration with over 40 underlying platforms including Aave, Curve, and Lido, using Exponential.fi's risk ratings to balance yield potential against protocol risk. Unlike opaque alternatives, allocations remain visible on-chain and strategy selection follows governance processes that provide collective oversight.
The Stablecoin Prime Rate serves as the benchmark for this analysis. Developed by 512M as an open-source index, the SPR represents a TVL-weighted average of yields across the 100 largest stablecoin liquidity pools in DeFi, calculated using DeFiLlama data. This weighting captures what the market collectively earns on stablecoin deposits, providing a baseline for evaluating active management strategies.
The analysis covers 191 days from May to November 2025, during which yoUSD grew from $6.5 million to $35 million in total value locked whilst maintaining consistent positive returns. The comparison with SPR reveals both the vault's outperformance and the nature of its risk-return profile across different market conditions.

Figure 1: APY comparison between yoUSD and the Stablecoin Prime Rate. The vault consistently outperformed the benchmark, with the performance differential widening during periods of broader market yield compression.
Performance Overview
The dataset reveals distinctive performance characteristics across the 191-day observation window. yoUSD delivered an annualised return of 10.3% compared to 5.5% for the Stablecoin Prime Rate, with zero negative return days recorded throughout. This outperformance occurred whilst total value locked grew from $6.5 million to $35 million, suggesting the strategy maintained capacity despite significant capital inflows.
| Metric | yoUSD | Prime Rate | Interpretation |
|---|---|---|---|
| Annualised Return | 10.3% | 5.5% | Nearly double the market baseline |
| Daily Volatility | 0.075% | 0.039% | Higher variability in daily returns |
| Sharpe Ratio | 6.83 | 7.24 | Similar risk-adjusted performance despite higher absolute returns |
| Alpha | 7.5% | — | Substantial excess return after accounting for market exposure |
| Beta | 0.48 | — | Captures less than half of market movements on average |
| Correlation | 0.25 | — | Limited dependence on broader market yields |
| Information Ratio | 63.8 | — | Unusually high; typical active strategies achieve 0.5 to 1.0 |
| Max Drawdown | 0% | 0% | No negative return periods observed |
| Skewness | 2.17 | — | Distribution tilted toward positive outliers |
| TVL–APY Correlation | 0.26 | — | Yields remained stable despite 5x growth in assets |
The relationship between TVL growth and yield stability merits particular attention. DeFi yield strategies typically face diminishing returns as capital scales: opportunities that generate attractive returns at $5 million often compress at $50 million as arbitrage narrows the spread. yoUSD maintained double-digit annualised yields whilst absorbing five times more capital, which could indicate genuine strategy capacity, though favourable market conditions during the observation period likely contributed.
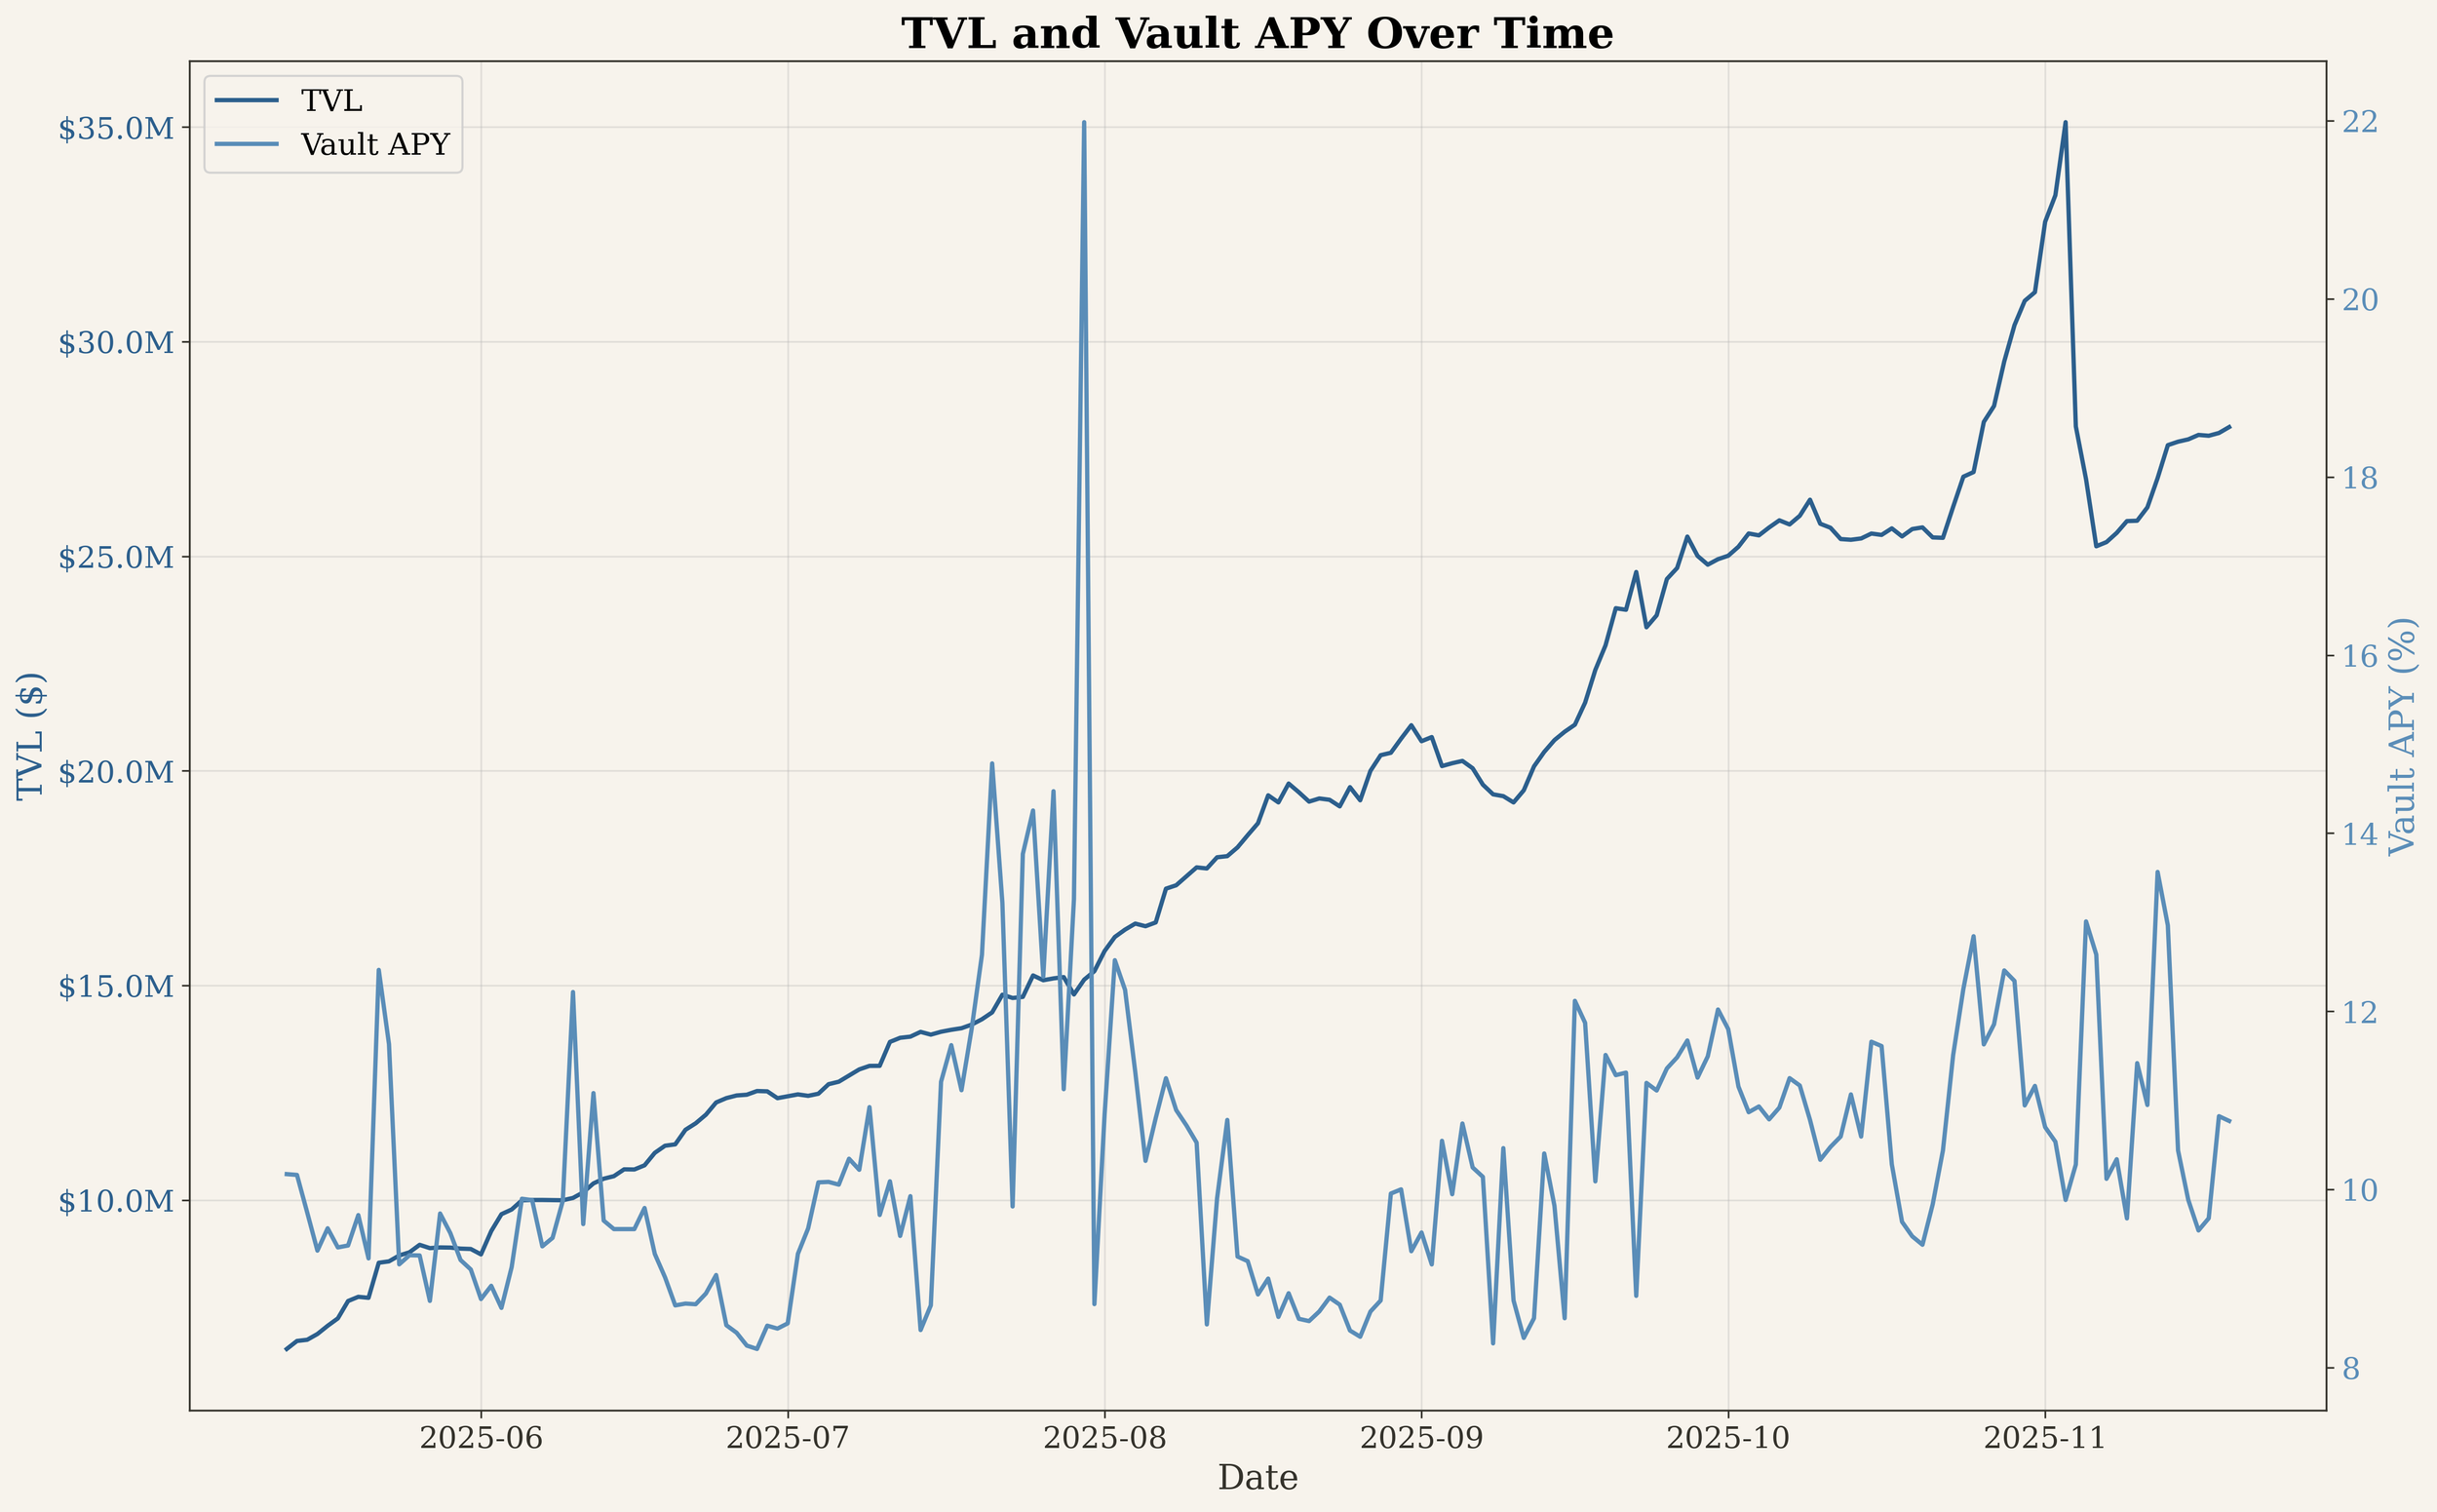
Figure 2: TVL and vault APY over time. Despite growing from $6.5 million to $35 million, APY remained within a relatively stable band, suggesting the strategy has not yet reached capacity constraints.
The distribution of daily returns reveals important characteristics about the vault's yield generation mechanism. The positive skewness of 2.17 indicates returns are distributed asymmetrically, with more frequent small gains punctuated by occasional larger gains. This pattern contrasts with strategies that generate consistent returns but hide tail risk, suggesting yoUSD's variability tilts toward the upside rather than concealing downside exposure.
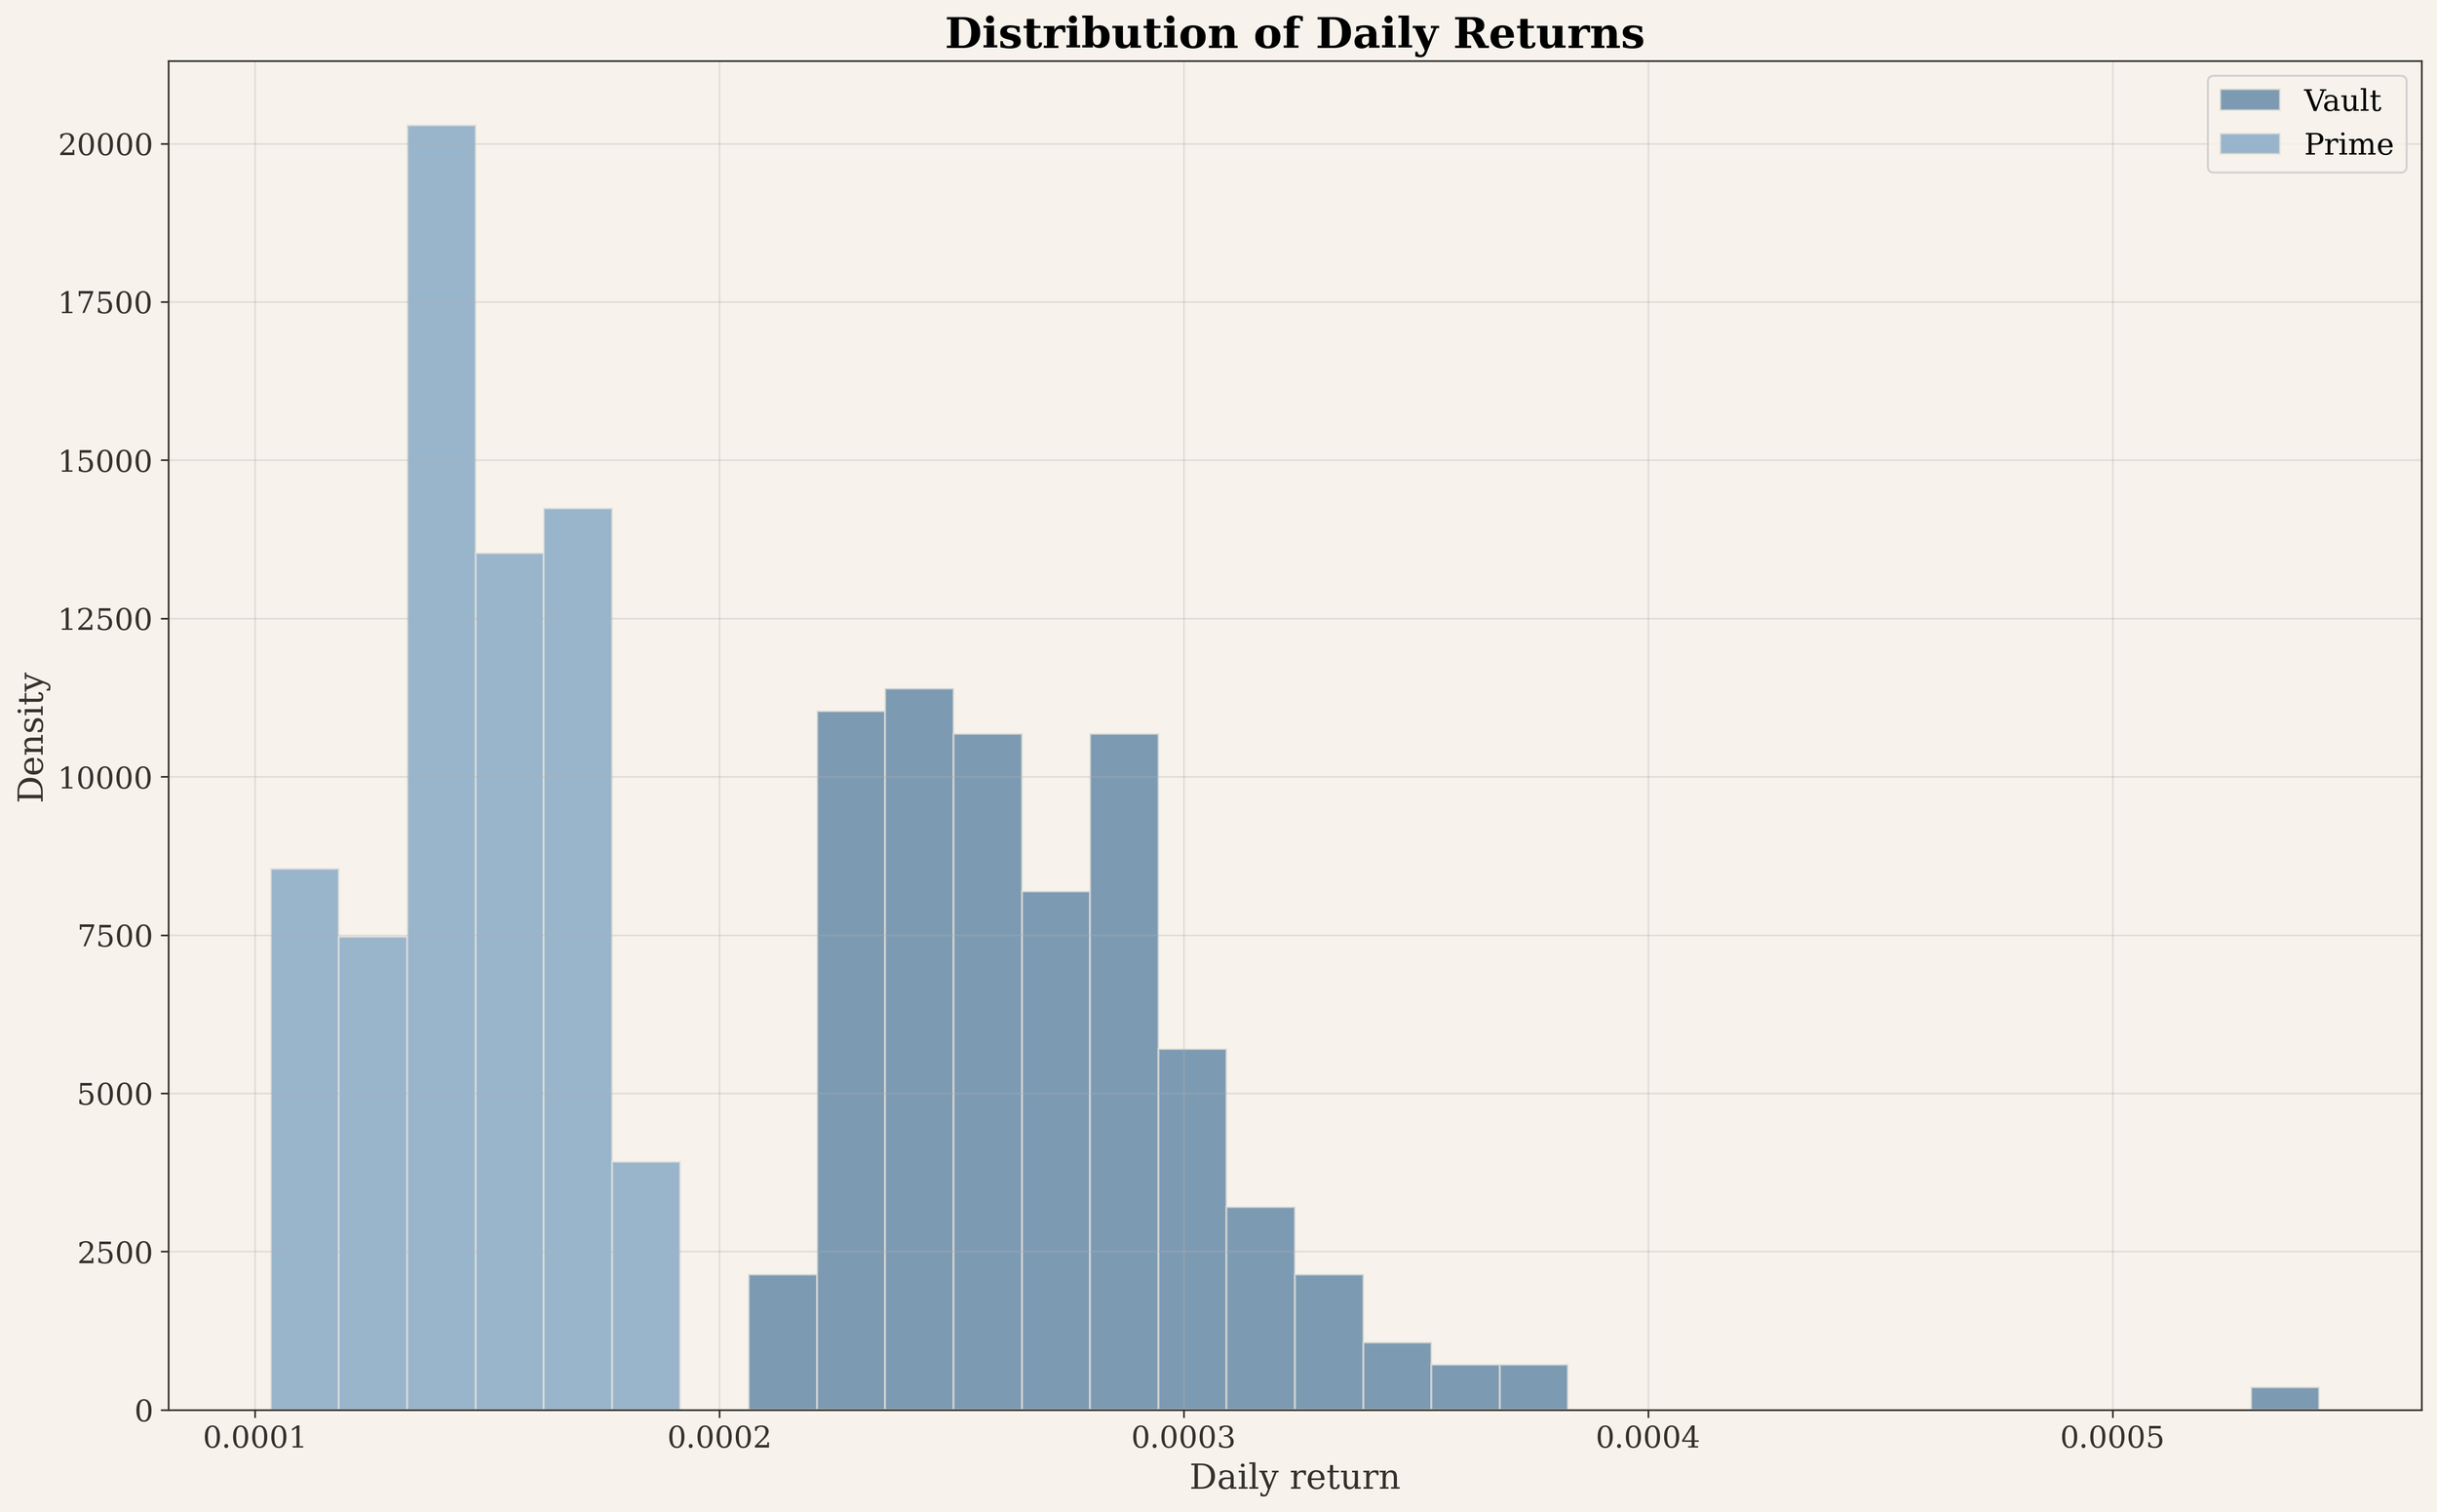
Figure 3: Daily return distributions. The vault's wider distribution compared to the SPR reflects active management, whilst positive skewness suggests upside variability dominates the return profile.
Portfolio Characteristics
Correlation and Market Independence
The relationship between yoUSD and broader market yields reveals important portfolio construction implications. With a correlation of 0.25 to the Stablecoin Prime Rate, the vault appears to generate returns largely independent of average DeFi yields. This low correlation suggests the strategy accesses different yield sources or timing than the broader market, rather than simply amplifying existing exposures.
For allocators with existing DeFi yield positions, this independence could provide diversification benefits. When baseline DeFi rates compress, yoUSD has continued generating returns, indicating the strategy may serve as a complement to rather than substitute for passive yield exposure.
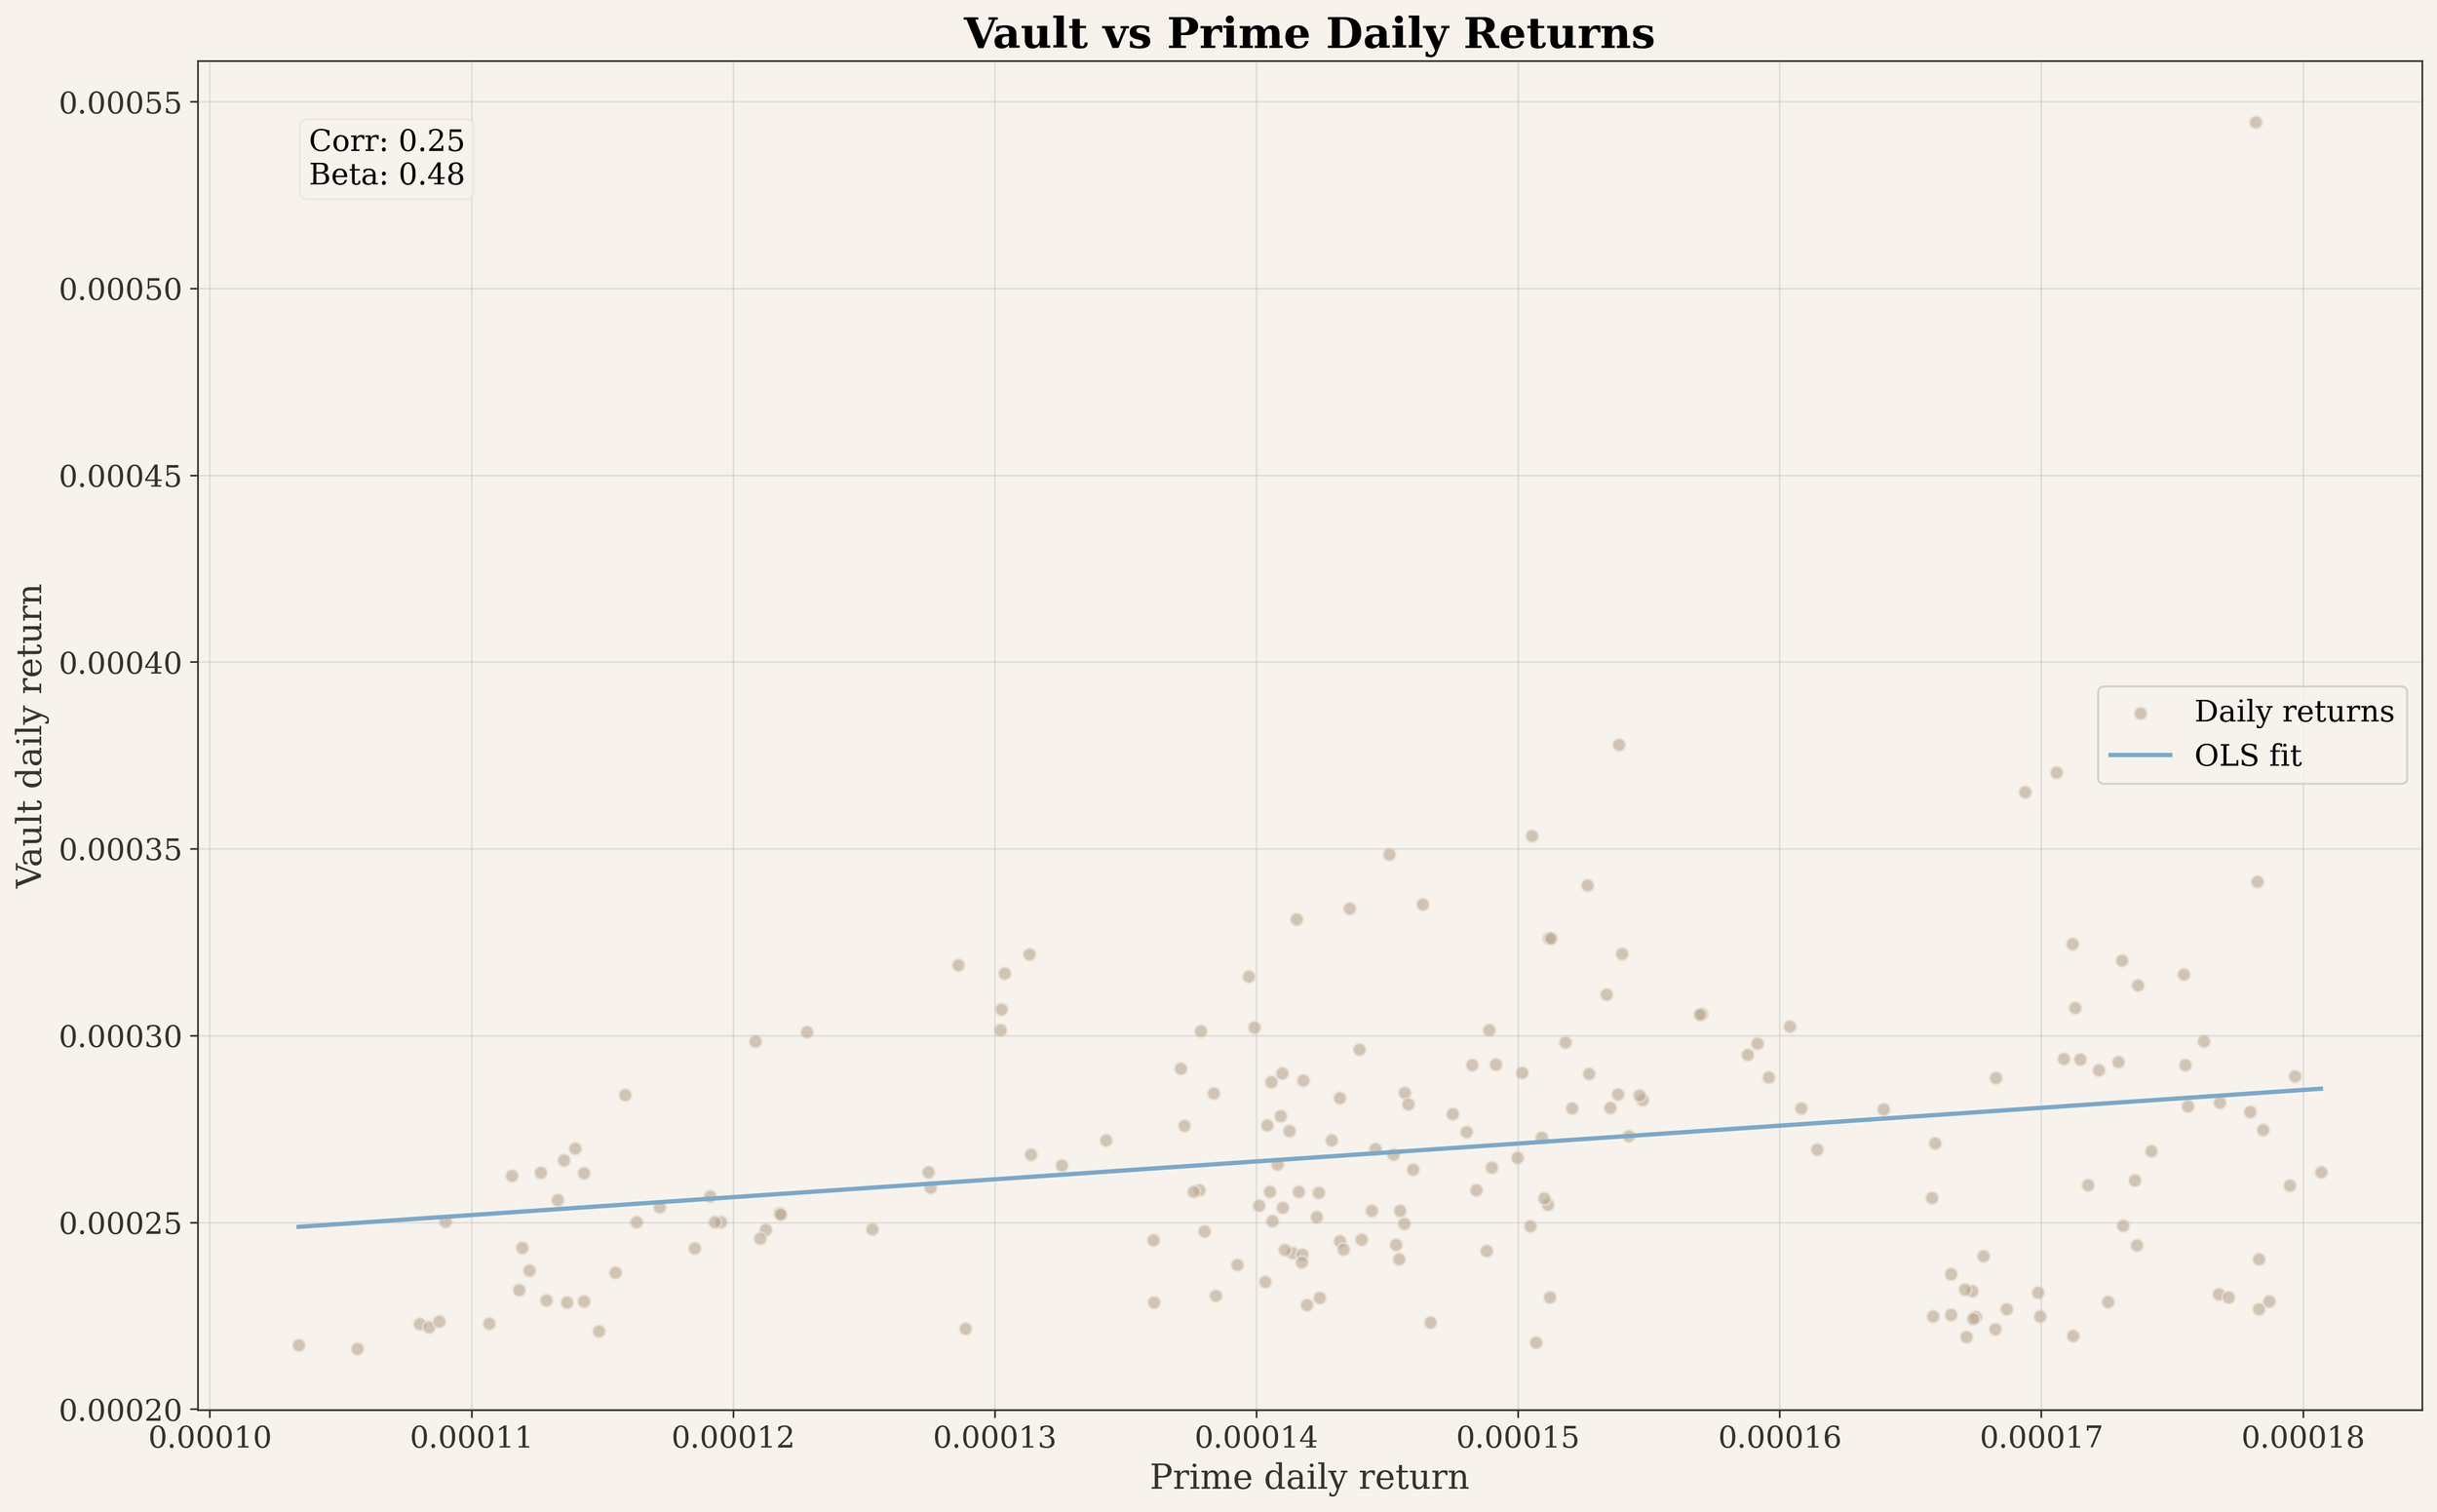
Figure 4: Scatter plot of daily returns. The shallow regression slope and low R-squared value indicate that SPR movements explain only a small fraction of yoUSD's return variation, consistent with the low correlation statistic.
However, this independence varies across market regimes. Analysis of different yield environments reveals that yoUSD's behaviour changes depending on broader market conditions. During periods when the Prime Rate fell below 5.26%, the vault exhibited different return characteristics than during high-yield periods above 5.78%. This regime dependence is consistent with an actively managed strategy that reallocates across opportunities, but it suggests allocators should not expect uniform behaviour across all market conditions.
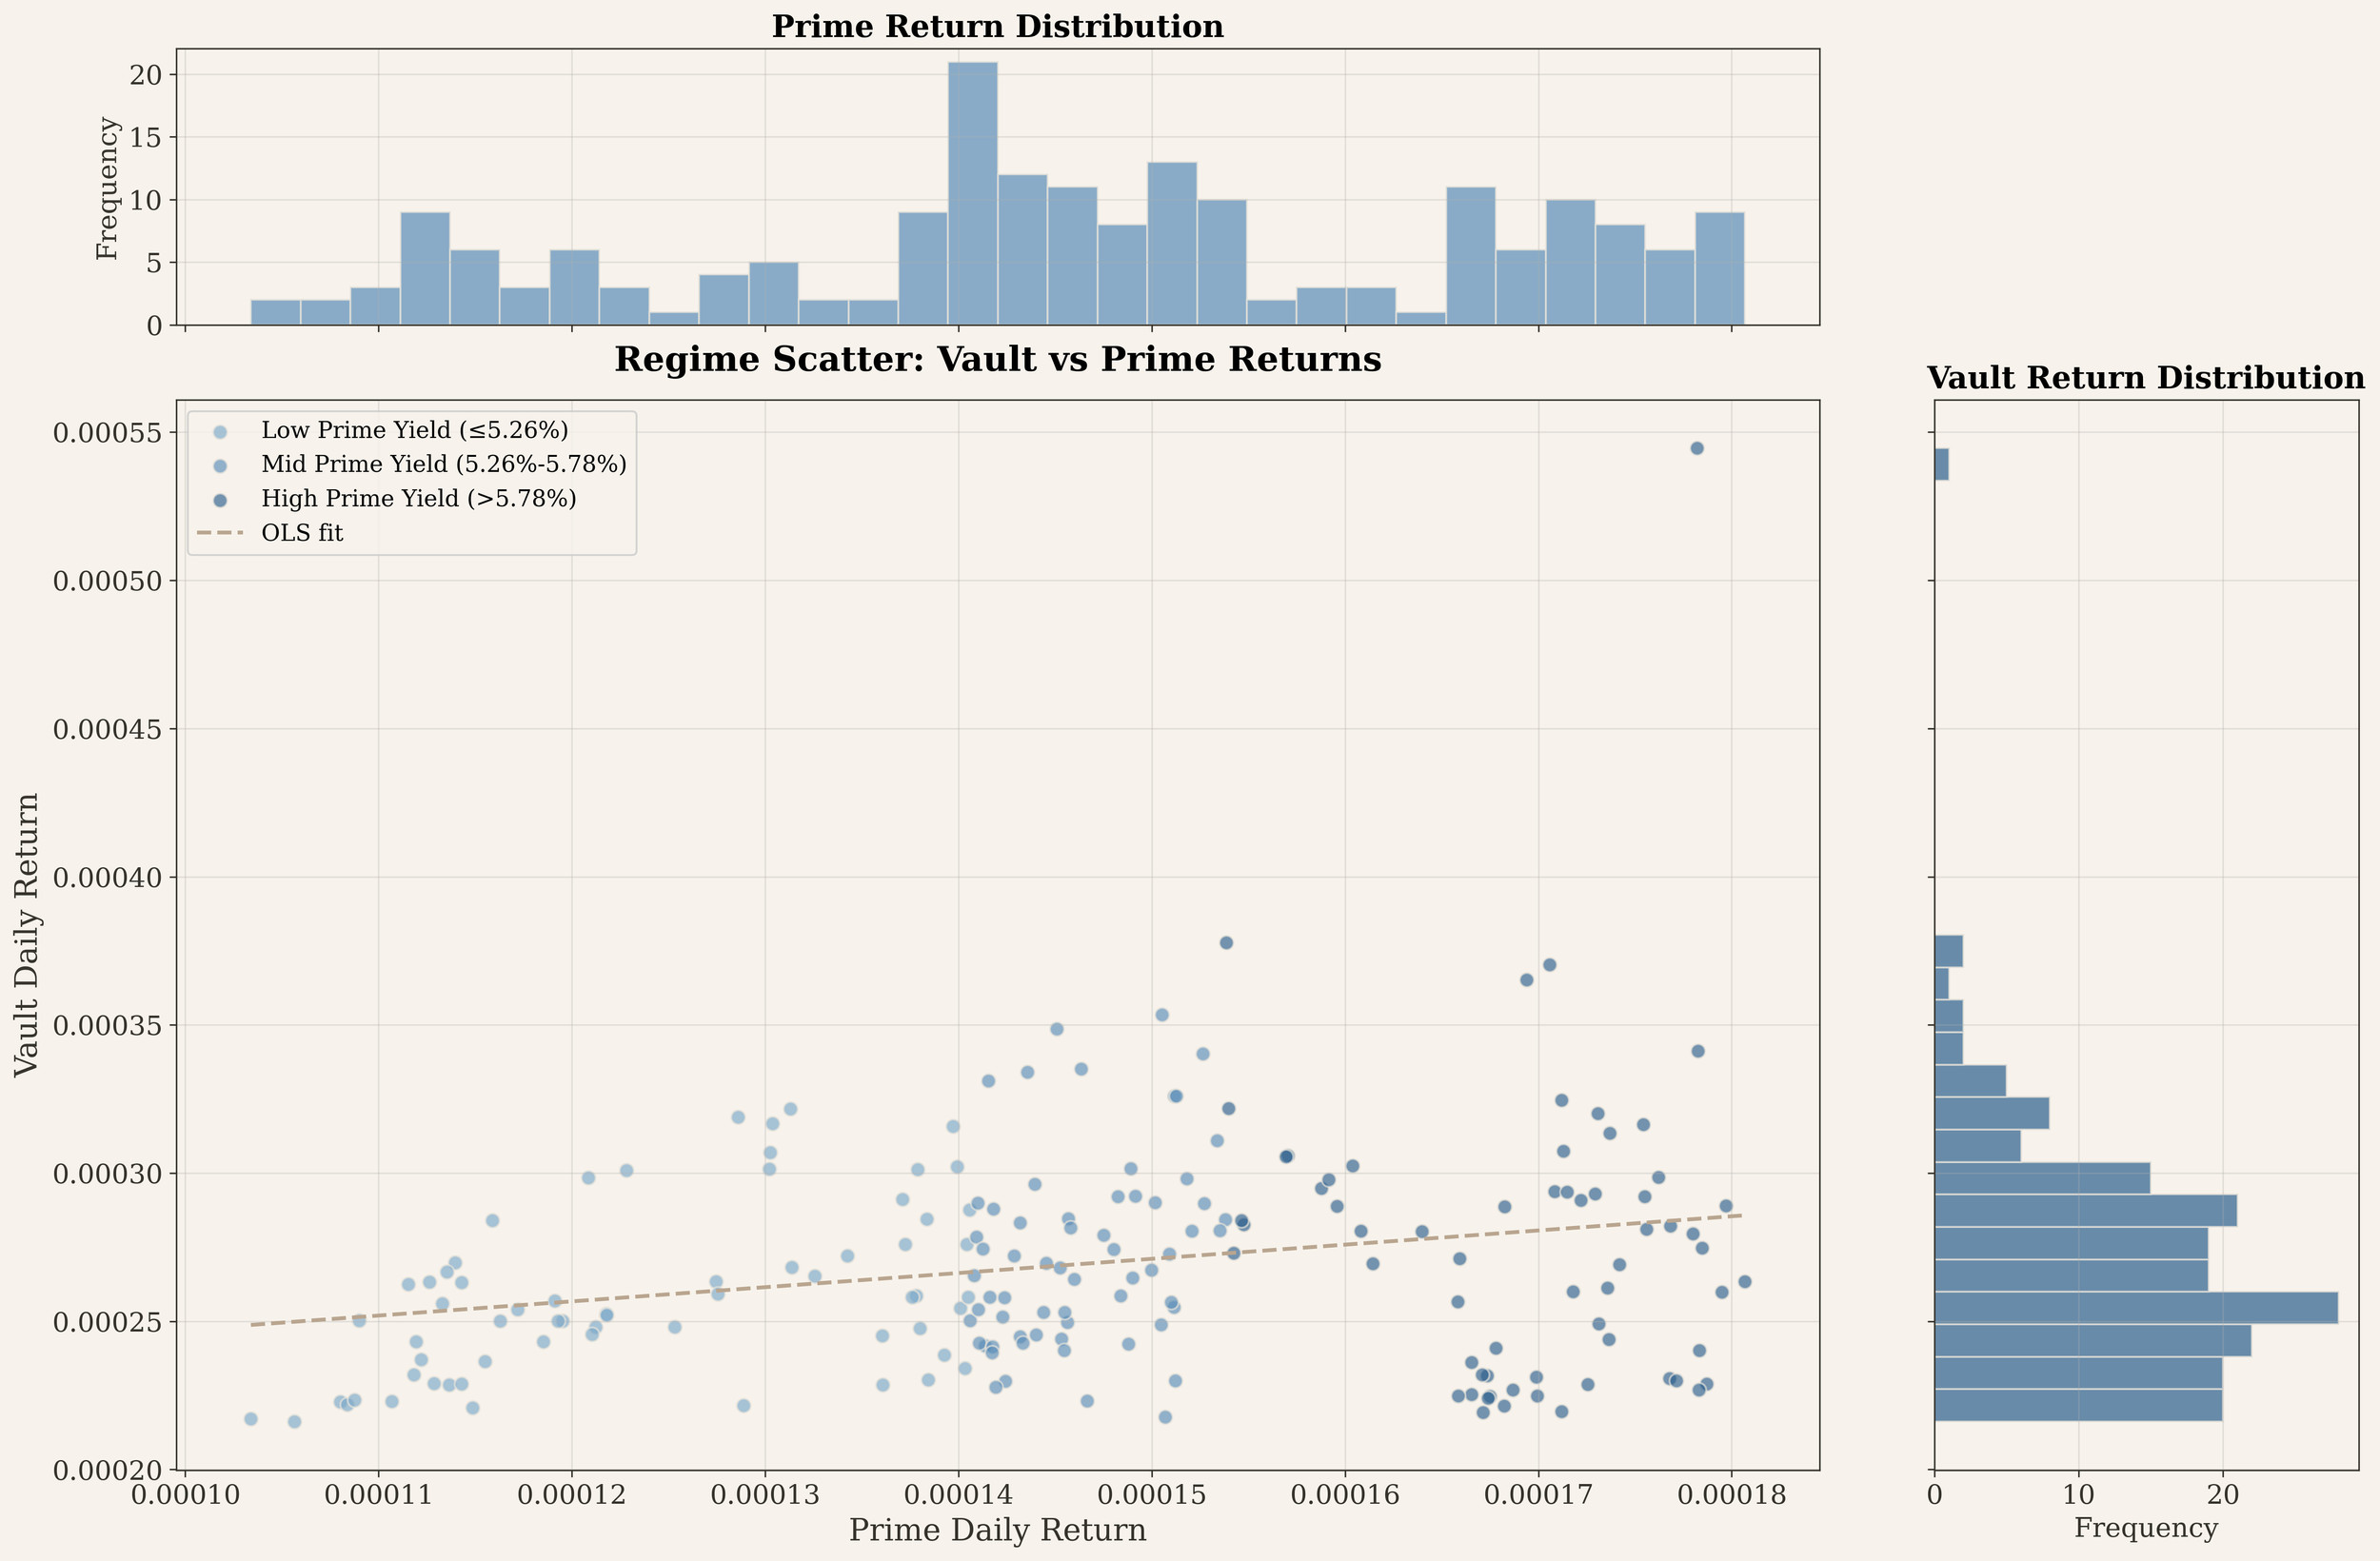
Figure 5: Returns segmented by SPR yield regime (low, mid, high). The vault maintained positive returns across all environments, though the relationship with market yields varied by regime.
Beta and Market Sensitivity
The aggregate beta of 0.48 suggests defensive positioning, with the vault capturing less than half of SPR movements on average. This could theoretically provide downside protection during yield compression periods. However, rolling 60-day beta analysis reveals substantial instability in this relationship, with values ranging from -1.0 to nearly +2.0 across the observation period.
This variability indicates that market sensitivity is not a fixed characteristic but rather shifts with strategy allocation and market conditions. At times the vault moved inversely to the market, whilst at others it amplified market movements. The implication for allocators is clear: the defensive positioning suggested by the overall beta cannot be relied upon as a consistent feature.
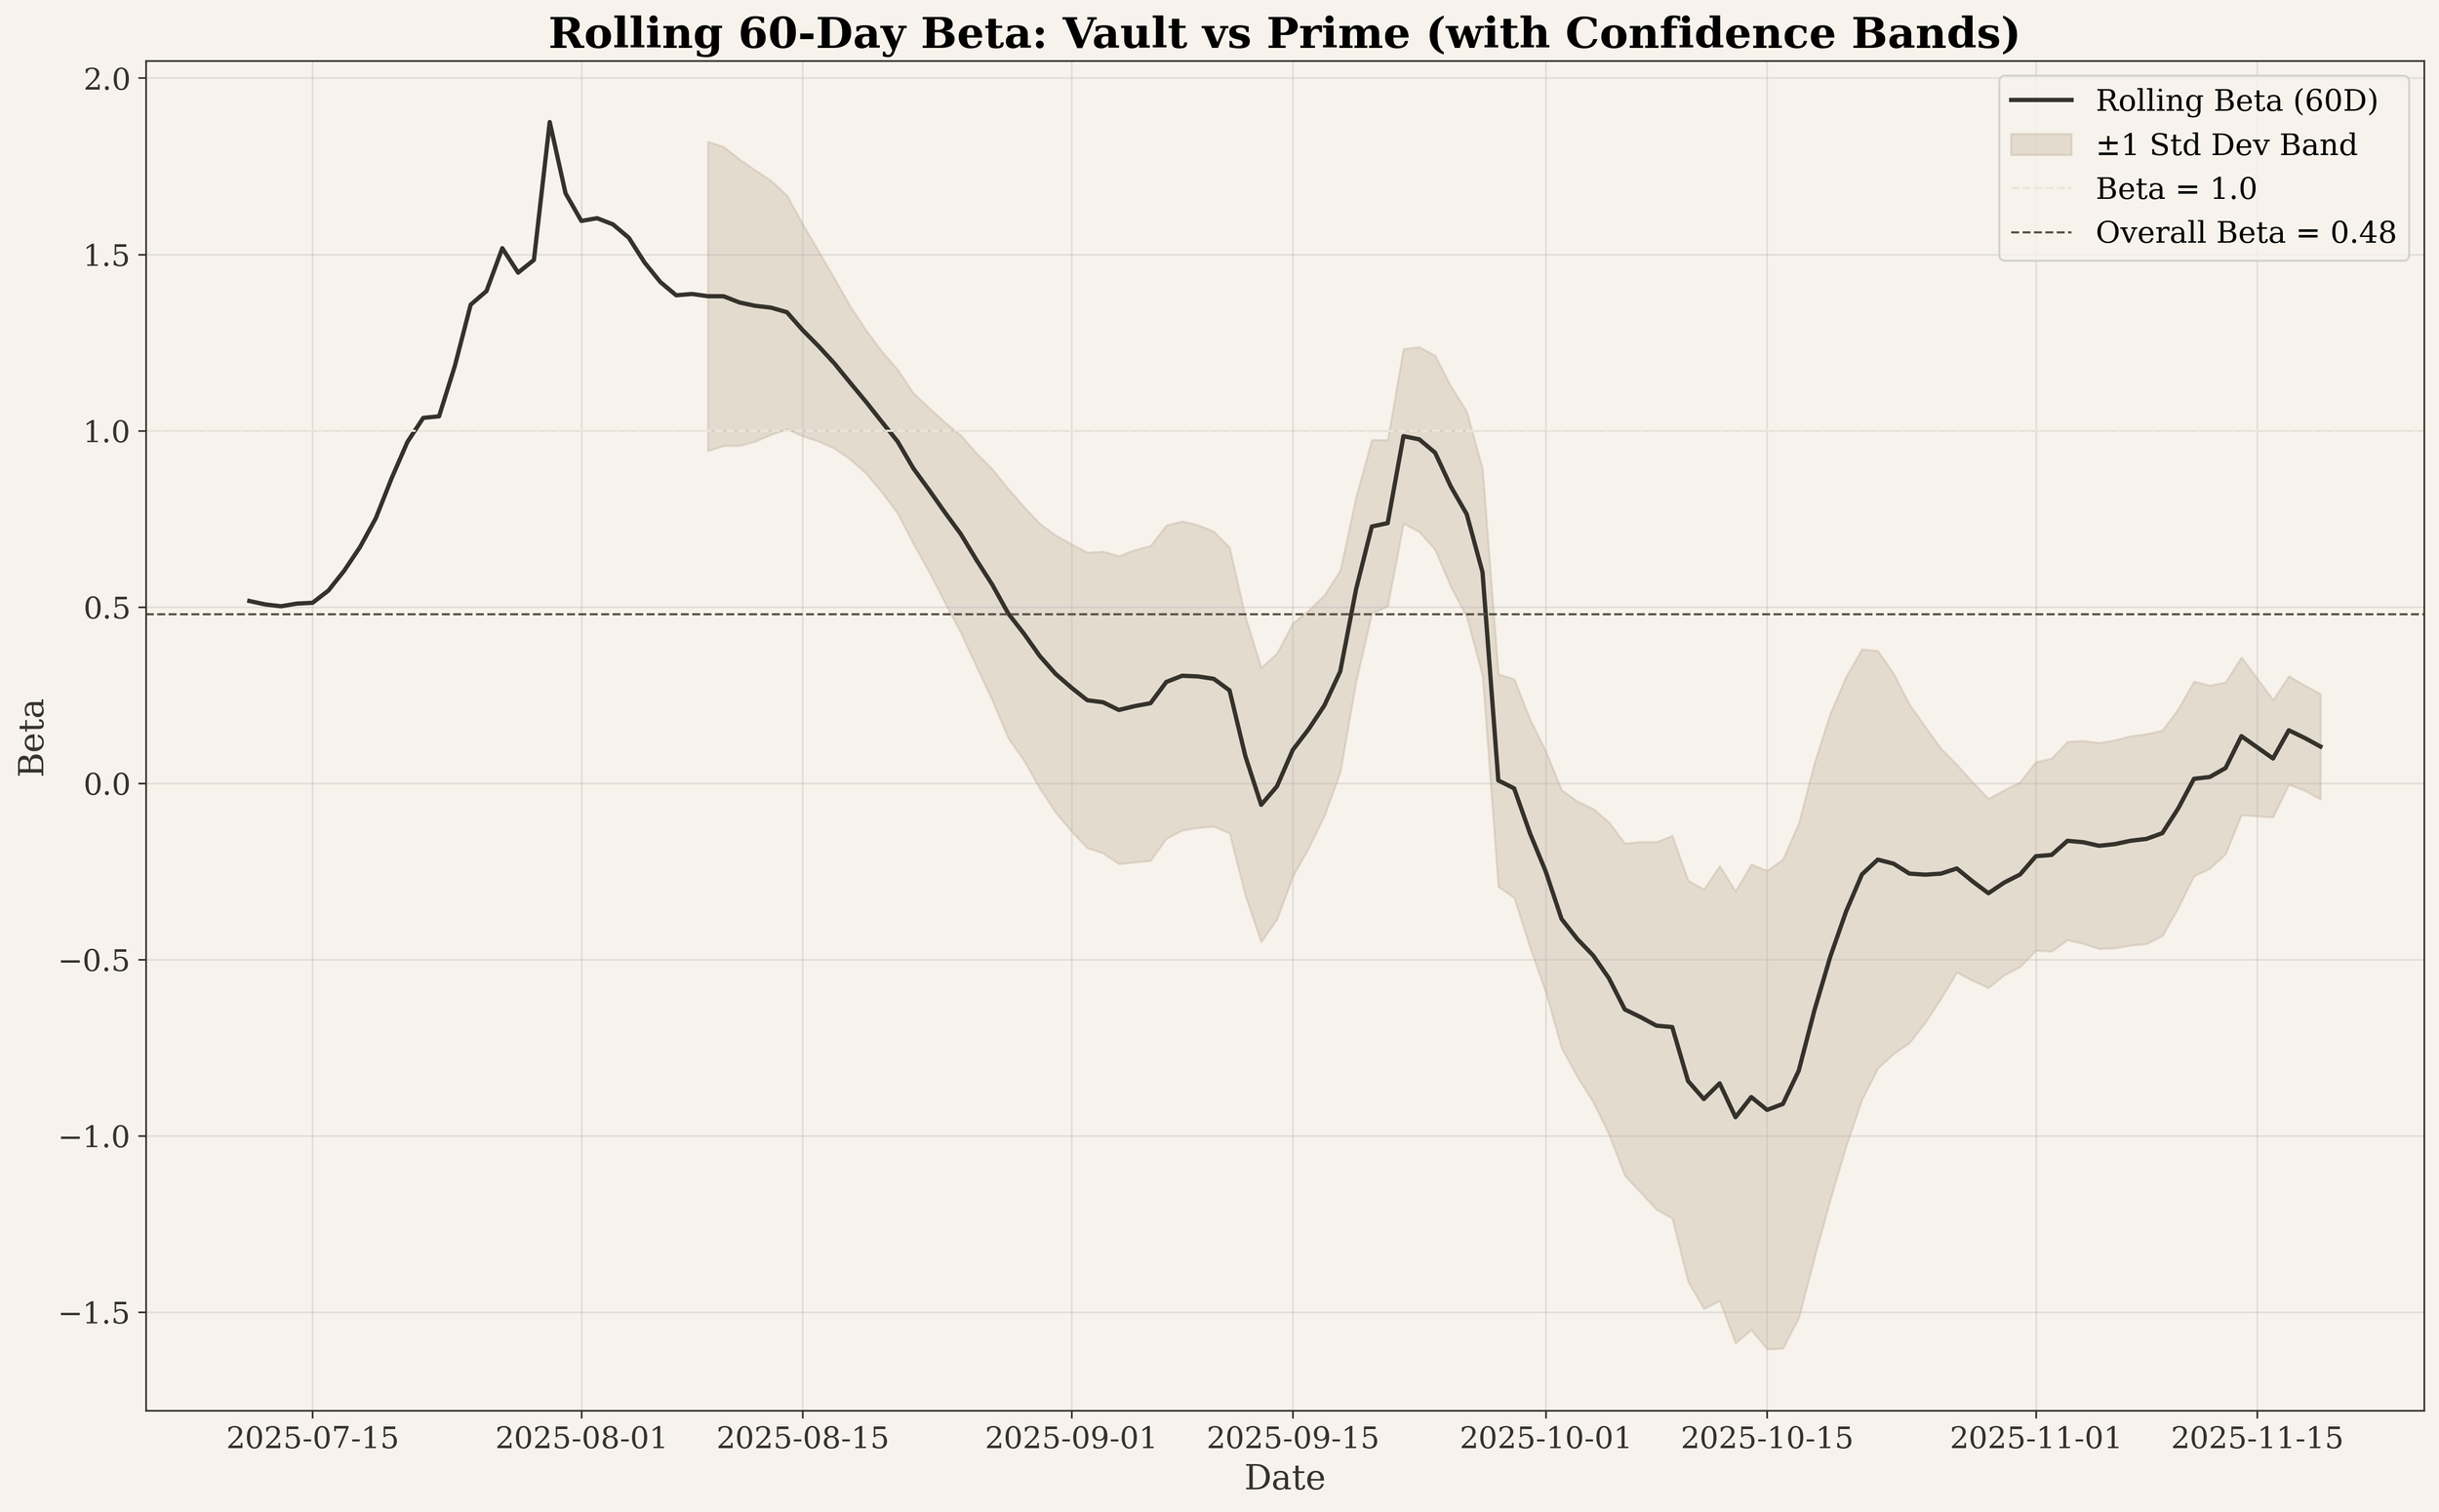
Figure 6: Rolling 60-day beta with confidence bands. The aggregate beta of 0.48 conceals substantial time-varying behaviour, with periods of both negative and strongly positive market sensitivity.
Temporal Stability of Performance Metrics
Analysis of rolling metrics provides insight into whether the observed performance characteristics represent persistent features or temporary phenomena. The evidence suggests considerable variation over time, raising questions about the stability of the aggregate statistics.
The rolling 90-day Sharpe ratio fluctuated between 5 and 9 for most of the observation period, indicating consistently strong risk-adjusted returns. However, a spike to approximately 14 in mid-October before convergence with the benchmark by November suggests that exceptional risk-adjusted performance may be episodic rather than structural.
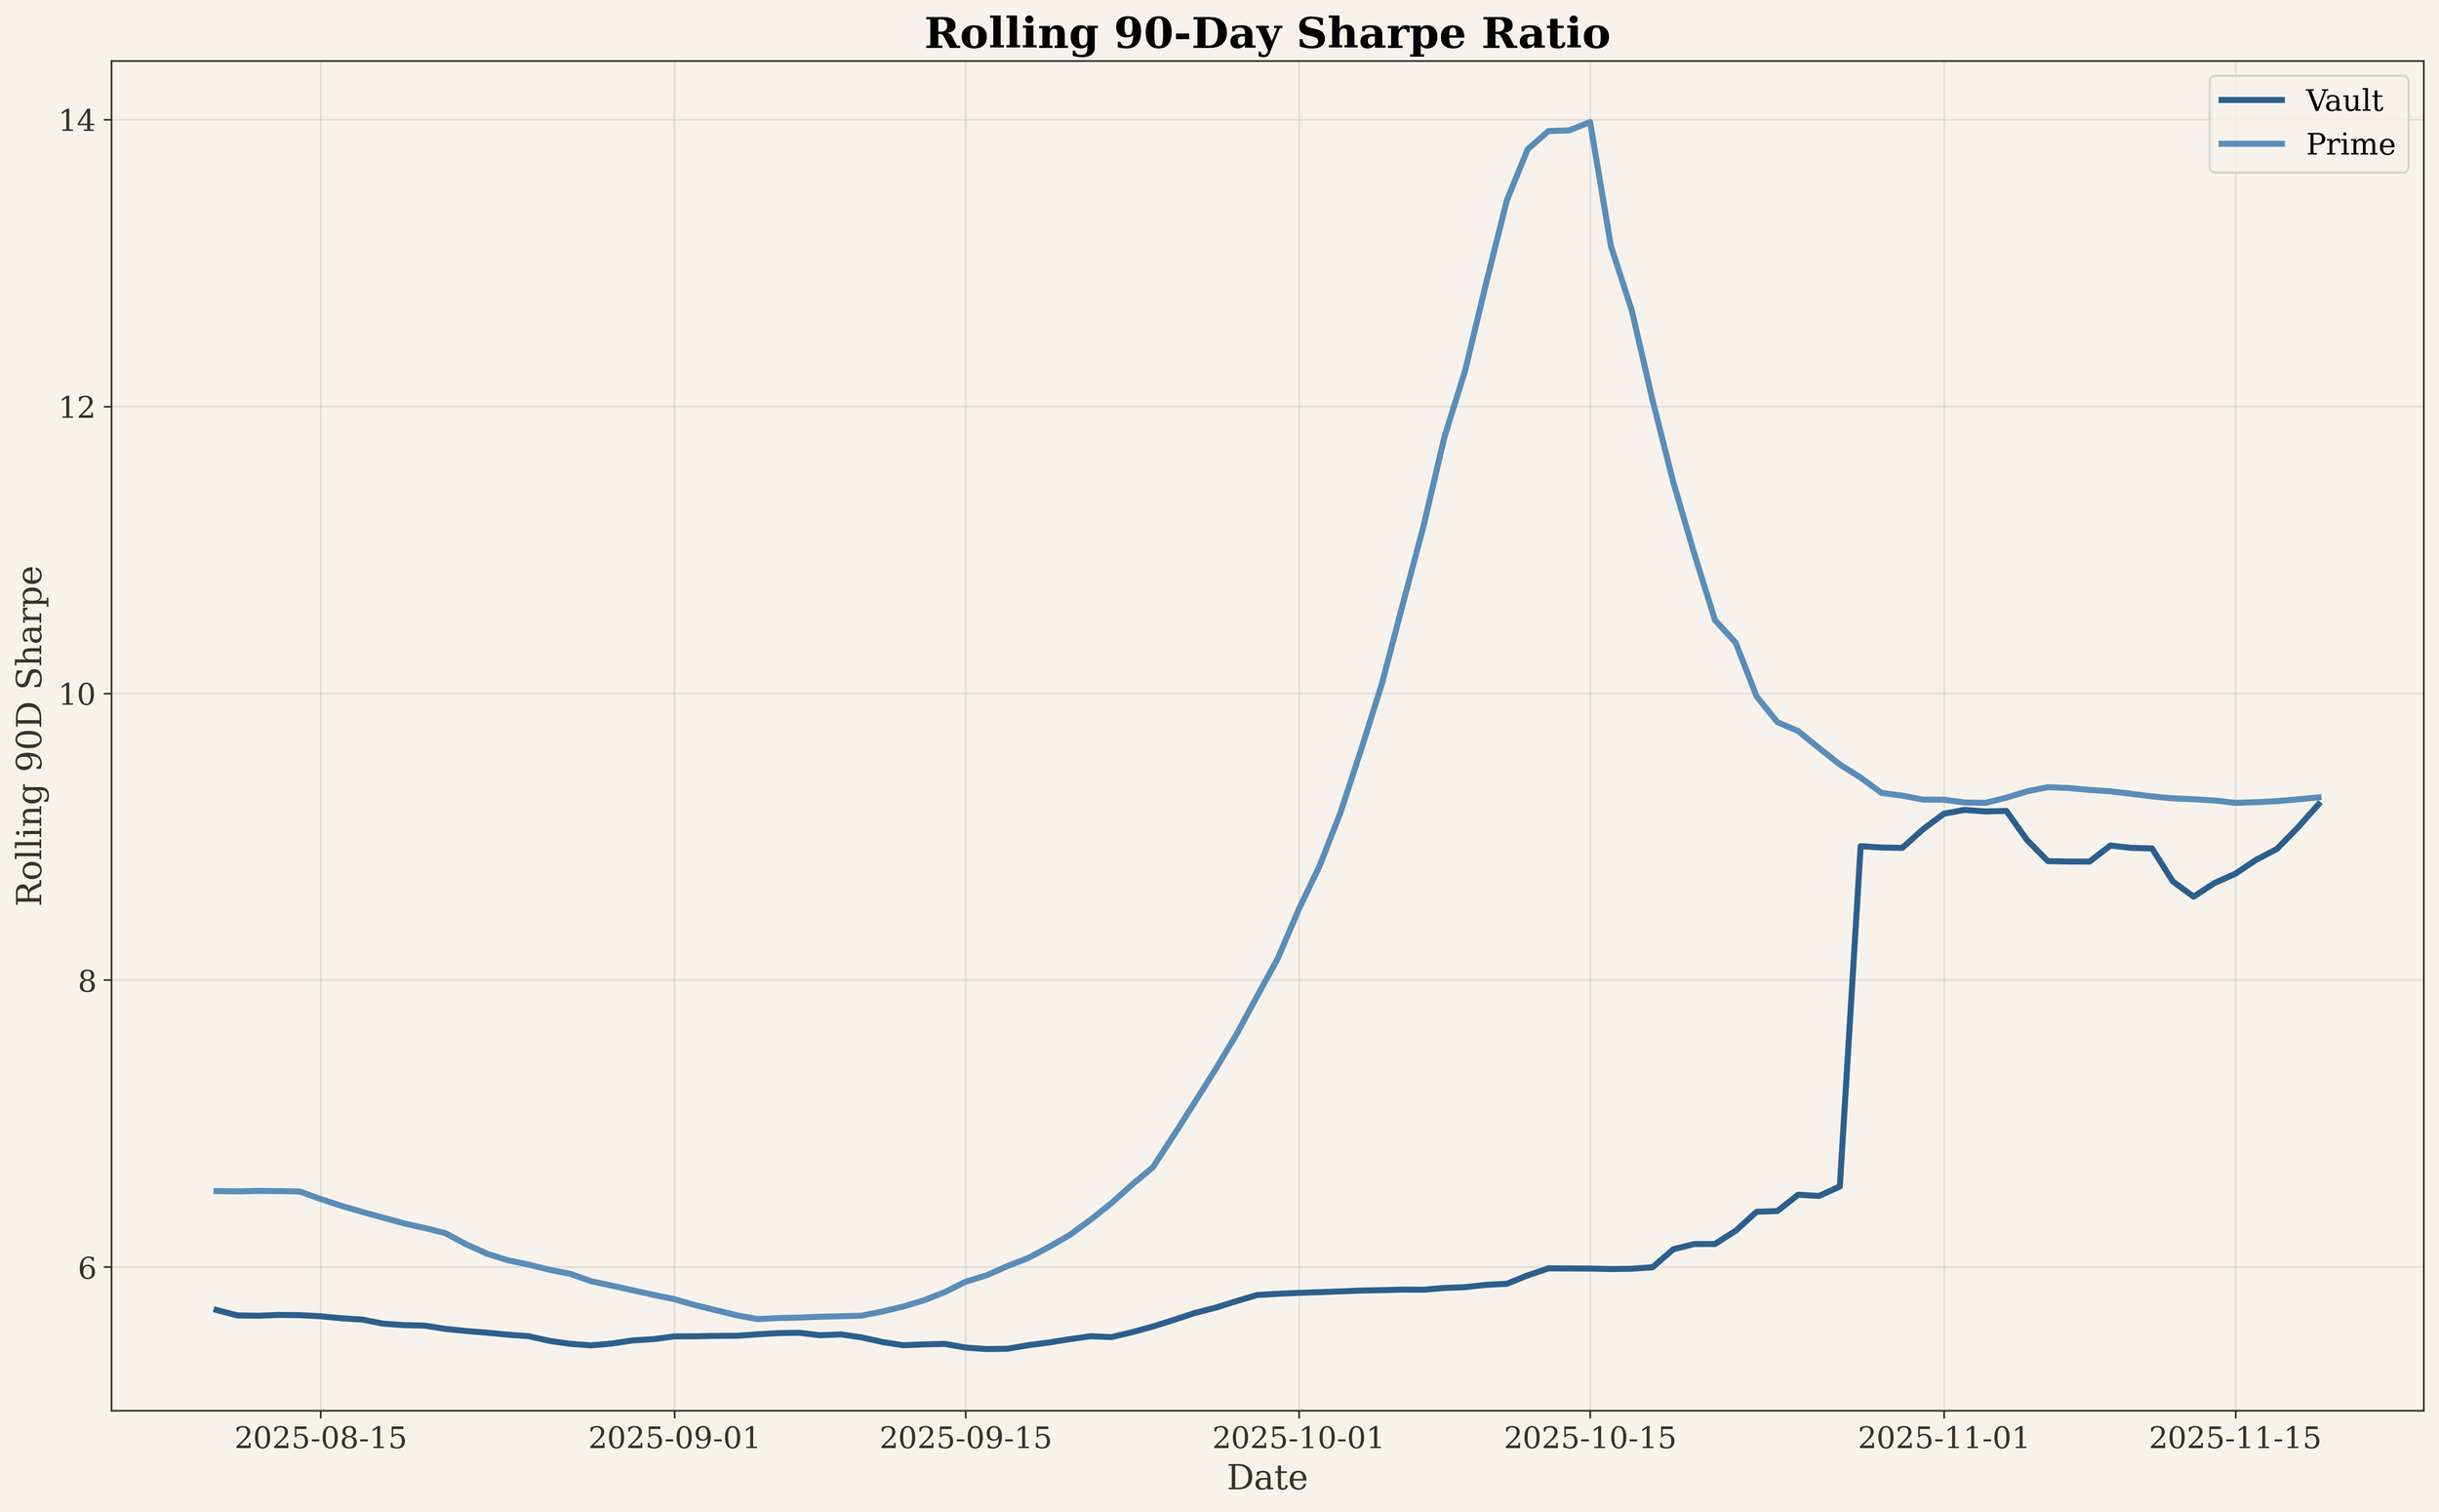
Figure 7: Rolling 90-day Sharpe ratios. The October 2025 spike and subsequent convergence with the SPR indicate that risk-adjusted outperformance varies considerably over time.
The instability becomes more pronounced when examining rolling correlation. Early in the observation period, correlation with the SPR reached 0.7 to 0.8, substantially higher than the aggregate 0.25 figure. By October, this relationship had reversed to approximately -0.5 before recovering toward zero by November. Such dramatic shifts indicate that the low overall correlation statistic obscures a highly variable relationship that allocators should consider carefully.
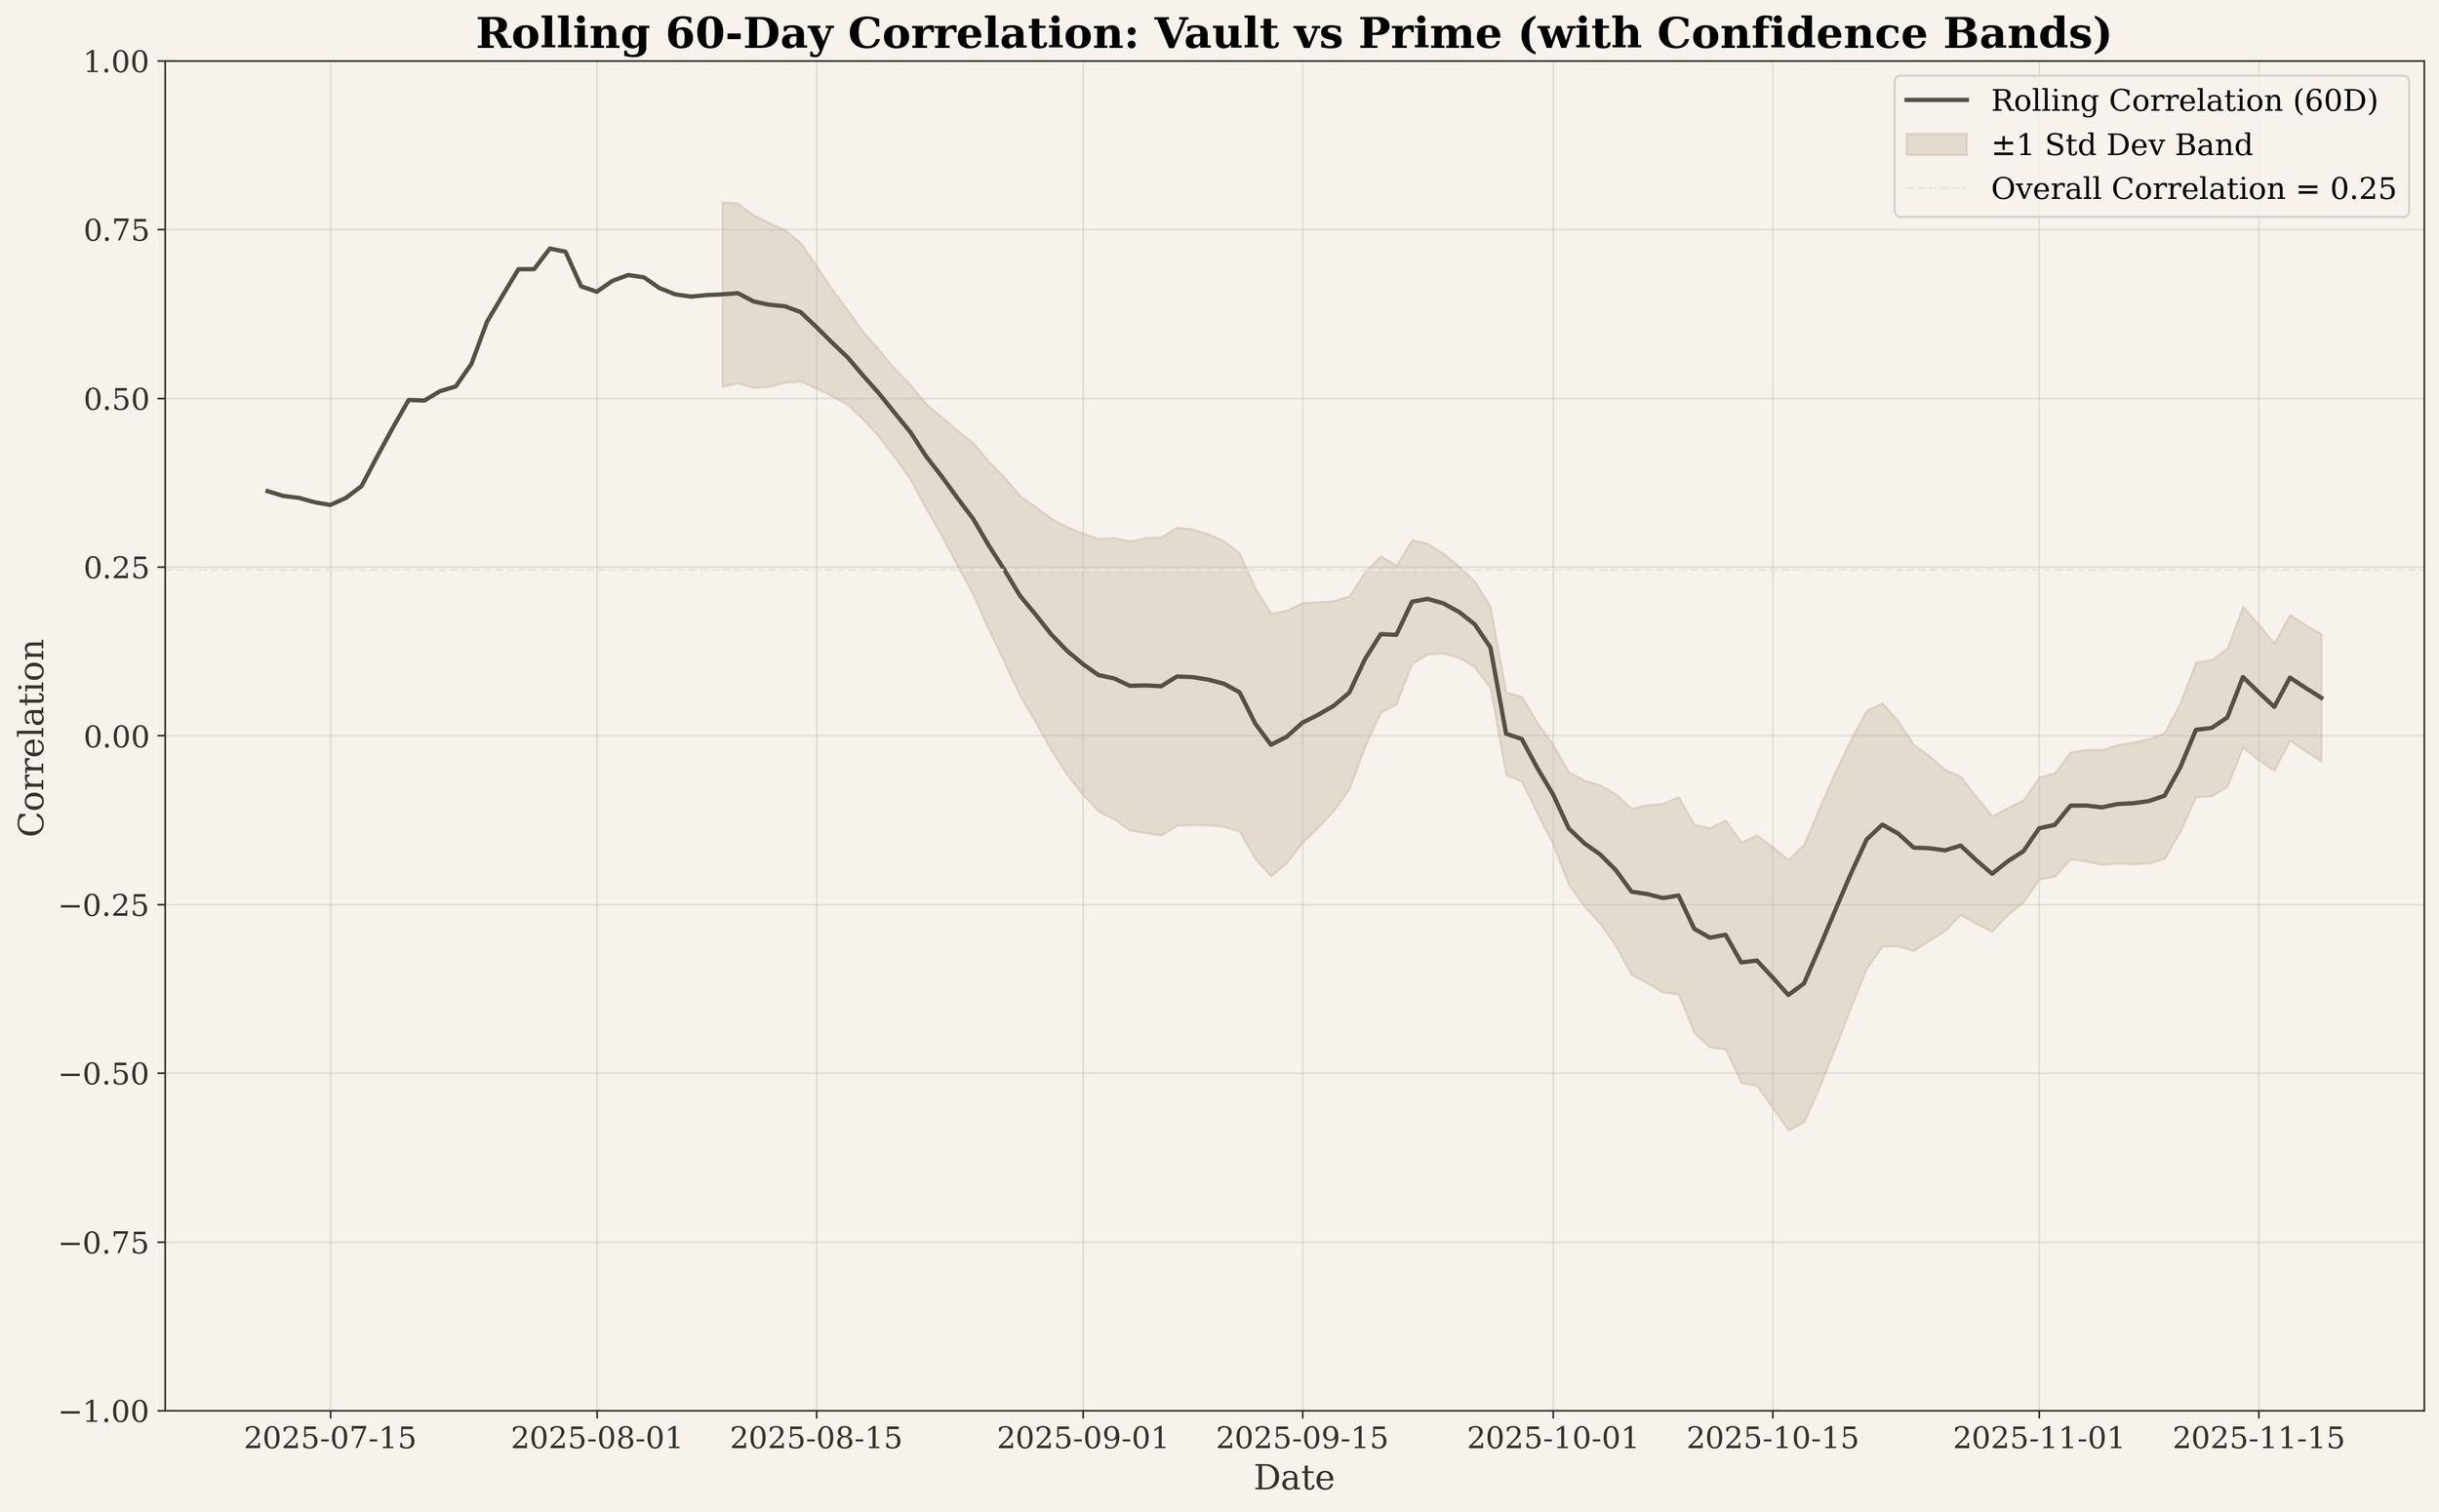
Figure 8: Rolling 60-day correlation. The relationship between yoUSD and the SPR proved highly unstable, swinging from strong positive correlation (+0.8) to negative correlation (-0.5) within the observation period.
Capacity and Scale Effects
The interaction between TVL growth and yield persistence provides crucial information about strategy capacity. The data reveal a slight positive correlation (0.26) between TVL and vault APY, an unexpected finding given typical DeFi scaling dynamics where yields compress as capital increases.
This counterintuitive result likely reflects favourable market timing rather than unlimited capacity. Nevertheless, APY remained relatively stable across the observed TVL range from $6.5 million to $35 million, avoiding the sharp compression that often accompanies rapid growth in DeFi strategies. Whether this stability persists at larger scales remains an open question.
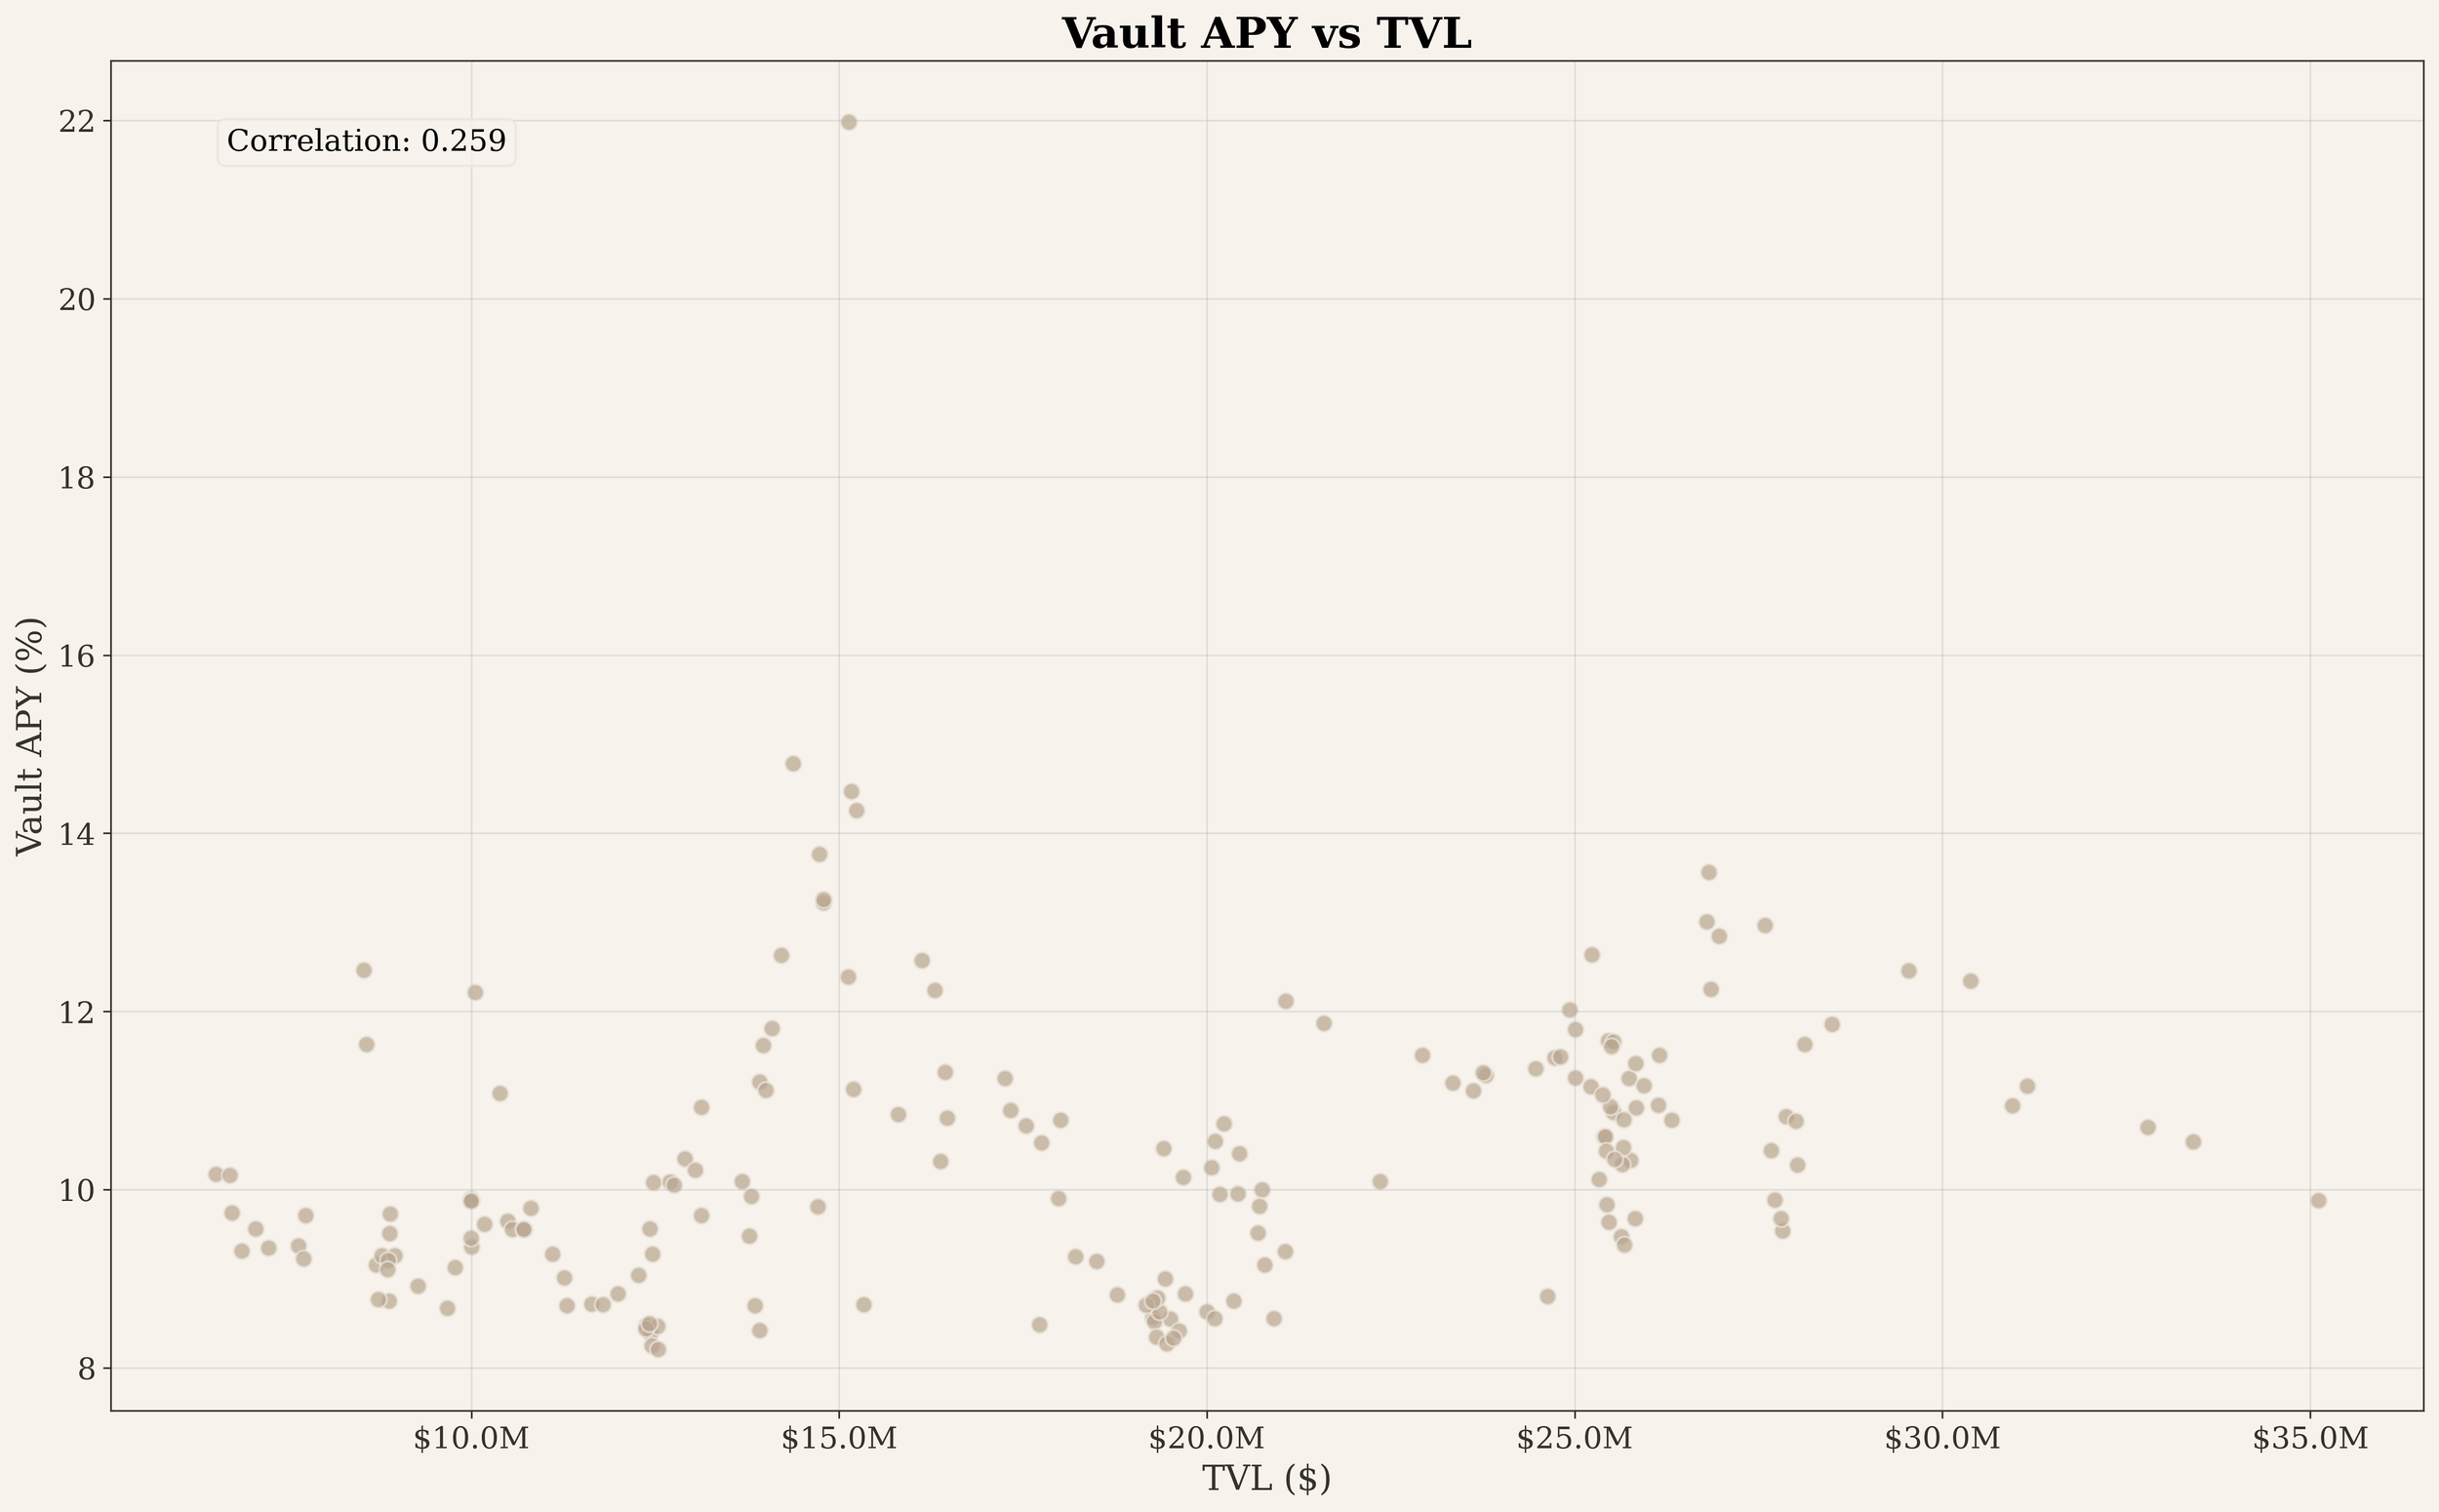
Figure 9: TVL versus APY relationship. The absence of yield compression despite 5x growth suggests the strategy has not yet reached capacity limits, though further scaling may reveal different dynamics.
Conclusion
The six-month analysis of yoUSD provides concrete evidence that disciplined yield generation need not sacrifice returns. With 10.3% annualised performance versus 5.5% for the Stablecoin Prime Rate, the vault nearly doubled market baseline yields whilst maintaining transparent, verifiable allocations. This outperformance occurred during a period of significant growth, with TVL expanding from $6.5 million to $35 million without observable yield compression.
The aggregate metrics paint an attractive picture: low market correlation (0.25), defensive beta positioning (0.48), and consistent positive alpha (7.5%). Yet the rolling analysis reveals these characteristics exhibit substantial variation over time. Correlation swung from +0.8 to -0.5; beta ranged from -1.0 to +2.0. These instabilities indicate that the vault's behaviour is regime-dependent rather than structurally fixed, a crucial consideration for portfolio construction.
Important limitations constrain these findings. The 191-day observation window cannot capture behaviour across full market cycles, excluding critical scenarios such as prolonged yield compression, stablecoin depegging events, or sustained bear markets. With zero negative return days observed, downside behaviour remains untested. The rolling analysis reveals that aggregate statistics mask significant time-varying behaviour, with correlation and beta exhibiting wide swings that make the overall figures unreliable guides for consistent positioning. Current performance at $35 million TVL may not persist at larger scales, as the positive TVL-APY correlation likely reflects favourable market timing rather than unlimited capacity. Additionally, unlike passive indices, yoUSD depends on active management decisions and automated rebalancing, introducing operational risks that allocators must weigh against the potential for higher returns.
Nevertheless, the data suggest that the trade-off between risk management and returns may be less severe than commonly assumed. In contrast to opaque strategies like xUSD that promise high yields but conceal their mechanisms, yoUSD demonstrates that transparent, governed protocols can deliver competitive performance whilst maintaining the observability necessary for ongoing risk assessment. For allocators navigating between the extremes of excessive caution and reckless yield-chasing, such strategies may offer a sustainable middle path.
The broader implication extends beyond any single protocol. As DeFi matures, the ability to generate attractive risk-adjusted returns whilst maintaining transparency and verifiability will likely separate sustainable strategies from those destined for eventual failure. In this context, yoUSD serves as one example of what disciplined yield optimisation can achieve when transparency takes precedence over marketing promises.
This article may contain material that is not directed to, or intended for distribution to or use by, any person or entity who is a citizen or resident of or located in any locality, state, country or other jurisdiction where such distribution, publication, availability or use would be contrary to law or regulation or which would subject 512m AG or its affiliates to any registration or licensing requirement within such jurisdiction. The information, tools and material presented in this article are provided to you for information purposes only and are not to be used or considered as an offer or the solicitation of an offer to sell or to buy or subscribe for securities or other financial instruments.