Subsidised Liquid Staking: dS and the Next Evolution of dTRINITY
Introduction
This article marks the latest entry in our ongoing analytical series on dTRINITY. Following the initial launch of dUSD, dTRINITY has now expanded its subsidised debt mechanism to a new product: dS, the subsidised Liquid Staking Token (LST) of Sonic. This marks dTRINITY’s deployment on Sonic, marking a significant expansion of its platform capabilities.
As with our previous evaluation of dLEND strategies involving dUSD, the present article adopts a quantitative approach to assess dS-based looping strategies. Our focus lies in evaluating the comparative performance of dLEND, dTRINITY’s native lending platform, against other major protocols such as Euler. We specifically assess how looping with Sonic-based LSTs performs under various market conditions, with simulations designed to model net yield outcomes across a range of scenarios.
What is dS?
dS extends the underlying principles of dUSD to the staking ecosystem of Sonic. While dUSD is fully backed by USD-denominated stablecoins and yield-bearing assets, dS is similarly collateralised by Sonic (S) and LSTs derived from the Sonic ecosystem. The yield generated from these reserves is directed toward interest subsidies, effectively reducing the cost of borrowing for users on dLEND and associated partner lending protocols.
Both dUSD and dS are now integrated into dLEND. Lenders on the platform can supply either token to earn returns composed of base yields and additional rewards. On the borrower side, users receive subsidised interest rates, which improves their net capital efficiency.

This mechanism has broader implications for current market dynamics in DeFi. By offering targeted interest rebates, dTRINITY effectively shifts the demand curve outward. This results in a new market equilibrium characterised by higher borrowing activity and increased utilisation, benefiting both lenders and borrowers. Such a structure demonstrates a novel application of classical economic theory within decentralised finance.

Simulation Parameters
To assess the effectiveness of dS looping strategies, we construct a simulation framework similar to the one used in our previous study on dUSD. The framework models the performance of leveraged staking strategies involving Sonic’s LSTs, such as dS or wS, across two platforms: dLEND and Euler (specifically the MEV Capital Vault).
Our primary performance metric is net yield over a one-year period. Importantly, this analysis abstracts from any price movements in Sonic itself and does not account for liquidation risks. The objective is to isolate yield optimisation via leverage, independent of exogenous price effects.
Both platforms are modelled using the following lending parameters:

Due to the money multiplier effect commonly found in DeFi lending protocols (and TradFi banks), the total value of dS debt in the system can become greater than the dS circulating supply. This can be measured via the debt-to-circulating supply ratio (or “debt ratio”), which is also the rate at which borrower subsidies are diluted. When there is more debt to service in the system vs. reserves backing dS, there are fewer reserve earnings to fund borrower subsidies.
For dS, we assume a constant debt ratio of 3 across all simulations. This represents an aggressive credit expansion scenario, suitable for stress-testing the performance under high-usage conditions. A total of 1,000 simulations are run, with each simulation spanning a 365-day period.
Simulating market dynamics
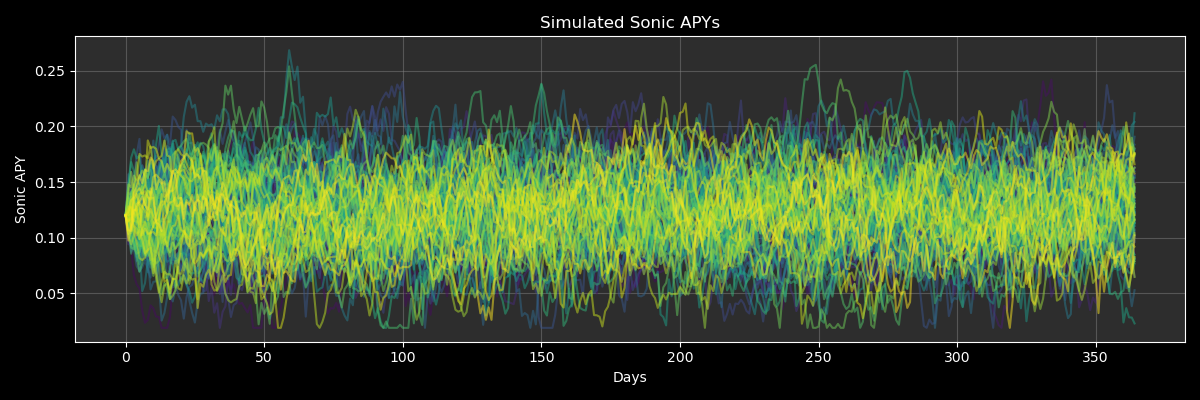
As in our earlier analysis, the simulation begins with generating stochastic paths for the staking APYs of Sonic’s LSTs, specifically stS and OS. The reserve of dS also earns these staking APYs, allowing dTRINITY to fund dS borrower subsidies with a majority of this yield. However, unlike the previous model, which relied on a normal distribution with mean reversion and jump diffusion processes, we have upgraded the stochastic engine to a GARCH (Generalised Autoregressive Conditional Heteroskedasticity) framework. This change allows for more accurate modelling of volatility clustering, a well-documented characteristic of financial time series.
In addition to GARCH volatility, we retain a mean-reverting mechanism to reflect the tendency of staking yields to converge toward equilibrium levels, and we incorporate jump processes to simulate sudden shifts in market conditions.
Using the resulting time series of staking APYs, we derive utilisation rates for both dLEND and Euler. These are calculated not only based on historical averages but also as a function of the prevailing staking APY. As yields increase, looping strategies become more attractive, prompting increased borrowing and consequently driving up utilisation rates.

The derived utilisation rates then serve as inputs to each platform’s interest rate model, allowing us to compute the borrowing cost in each simulated scenario. It is observed that while dLEND tends to offer lower borrow rates on average, its design, optimised for high utilisation, can lead to significant spikes during peak demand periods.

Performance Results
Having completed the simulations, we analyse the resulting performance of a looping strategy involving an initial deposit of $10,000, maximally looped through either dLEND or Euler using Sonic-based LSTs. The focus remains on the final net yield achieved after one year.
The results show that dLEND consistently outperforms Euler in this specific use case. Across all simulations, the mean return for dLEND is approximately 18% higher than that of Euler. This reflects dLEND’s architecture, which is tailored for aggressive leverage and capital efficiency.

Furthermore, when the data is segmented by market regime, bullish, neutral, and bearish, dLEND maintains superior performance across all categories. However, the margin of outperformance narrows under bearish conditions, where both platforms experience reduced yield-generating capacity.
An important observation concerns the distributional characteristics of returns. dLEND demonstrates a much tighter distribution, indicative of more consistent performance, while Euler’s return profile is notably more volatile. Across all simulations, Euler’s standard deviation is 49% higher than that of dLEND, underscoring the increased risk exposure inherent in its less conservative interest rate model.

Conclusion
The findings of this article highlight the efficacy of dLEND for yield optimisation strategies involving Sonic’s LSTs. When used for looping, dLEND offers not only higher expected returns but also more predictable outcomes when compared to Euler.
Nonetheless, this assessment is limited to APY-based yield outcomes. It deliberately abstracts from Sonic’s underlying price volatility. Given that dLEND enables higher leverage, it inherently exposes users to greater downside risks in adverse market conditions.
Moreover, the current borrowing environment on dLEND, as of 12 May, differs significantly from our simulation assumptions. In practice, borrow rates remain extremely low, occasionally negative, due to the recent launch and underutilisation of dS. These conditions are expected to normalise as adoption increases and debt ratios reach more sustainable levels.

In summary, while dLEND appears structurally superior for leveraged staking strategies under the modelled parameters, users must remain cognisant of the broader risk landscape, particularly when market prices are not stationary.
This article may contain material that is not directed to, or intended for distribution to or use by, any person or entity who is a citizen or resident of or located in any locality, state, country or other jurisdiction where such distribution, publication, availability or use would be contrary to law or regulation or which would subject 512m AG or its affiliates to any registration or licensing requirement within such jurisdiction. The information, tools and material presented in this article are provided to you for information purposes only and are not to be used or considered as an offer or the solicitation of an offer to sell or to buy or subscribe for securities or other financial instruments.