Open Stable: Capturing the Stablecoin Economy
Introduction
Decentralised finance has become a backbone of the blockchain economy, with the past year underscoring how central stablecoins and the surrounding infrastructure have become. The rise of platforms that underpin stablecoin issuance, liquidity, and yield, such as Pendle, Euler, and others, has been particularly strong.
Despite this momentum, the investable universe evolves rapidly, and there are very few credible options for investors seeking passive exposure to the theme, rather than actively selecting and managing assets. Historically, the DeFi Pulse Index (DPI) from IndexCoop was the closest fit, but it was sunset earlier this year. OpenStablecoinIndex is designed to fill that gap.
What is Open Stablecoin Index?
OpenStablecoinIndex is a long-only cryptocurrency index strategy focused on stablecoin infrastructure and adjacent blue-chip DeFi assets. It is implemented via Reserve Protocol's Decentralised Token Folio (DTF) under ticker $OPEN. Reserve Protocol is a platform that allows users to launch on-chain indexes and has around 500 million USD in Total Value Locked (TVL) as of the writing of this article. The $OPEN index targets equal weights and uses a time-based rebalancing approach complemented by dynamic asset inclusion rules. A DAO can determine which assets to add or remove over time, allowing the index to stay aligned with the underlying market structure while keeping implementation simple for end investors. The product is intended as a passive investment vehicle for investors who believe in the long-term growth of stablecoin adoption and DeFi infrastructure and who prefer diversified, rules-based exposure over single-name risk.
The current investable universe comprises 10 DeFi tokens, with scope to expand as new credible names emerge. $OPEN launched in April 2025 and has grown since. The full list is as follows:
| Asset | Token Launch Date | Inclusion Reasoning |
|---|---|---|
| MKR | 20 Dec 2017 | Foundational stablecoin issuer at the heart of DeFi |
| SKY | 24 Sep 2024 | Sky/Endgame upgrade path around DAI/USDS |
| RSR | 24 May 2019 | Diversified stablecoins and on-chain reserve management |
| FRAX | 20 Dec 2020 | Issuer with significant stablecoin/ETH-collateral activity |
| CRV | 15 Aug 2020 | Canonical stableswap/liquidity venue for stablecoins and LST |
| OGN | 11 Jan 2020 | Yield-bearing stable assets and associated yield infrastructure |
| AAVE | 4 Oct 2020 | Blue-chip money market facilitating stablecoin supply at scale |
| INV | 6 Mar 2021 | Blend of stablecoin minting, lending and risk controls |
| LQTY | 6 Apr 2021 | Pure-play on decentralised, collateralised stablecoin design |
| FXN | 30 Sep 2023 | High & Sustainable USD yield & Liquidation Protected Leverage |
| ALCX | 28 Feb 2021 | Stablecoin-native credit primitive |
This article asks a simple, decision-useful question: how would $OPEN have performed if it had existed from the beginning of 2021, and how sensitive are results to different rebalancing parameters?
Backtesting
OpenStablecoinIndex's rebalancing logic
The current $OPEN rebalancing logic combines time-based cycles with threshold-based triggers and composition changes:
Time-based rebalancing. The base configuration rebalances at a fixed 90-day interval to restore equal weights. In the optimisation study, later we also explore 30-, 60- and 180-day schedules to quantify the trade-off between letting winners run and controlling drift.
Threshold-based triggers (bands). Outside the fixed schedule, the engine rebalances if any asset’s weight exceeds an upper band or falls below a lower band. This prevents excessive concentration and avoids orphaned tail positions while still allowing meaningful drift. The optimisation later tests upper bands in the 25–45% range and lower bands in the 1–5% range; the base case uses 1% and 40% respectively.
Composition changes. When a new token becomes eligible under the index rules, the portfolio is rebalanced on the listing date to incorporate it at the target equal weight; the same approach applies to removals. This reflects how a live index would keep pace with credible additions to the stablecoin-infrastructure stack
Backtest setup
The backtest is implemented with event-driven daily portfolio accounting and end-of-day weights. We evaluate a base case: 90-day schedule with band triggers and composition changes enabled, against ETH as the beta benchmark, and then run a parameter sweep across rebalancing frequencies and band settings. The configuration is as follows:
| Period | 1 January 2021 to 24 August 2025 |
|---|---|
| Starting index level | 100 |
| Fees | 0.75% p.a. applied daily (≈0.002% per day) to reflect management costs |
| Benchmark | ETH, to represent broad DeFi beta and providing a stringent hurdle for a diversified basket. |
| Rebalancing | 90-day base schedule with adaptive triggers for band breaches and composition changes as described above. |
| Data | Daily return series for all constituents sourced from CoinGecko; no look-ahead or survivorship adjustments beyond the explicit composition-change logic. |
| Universe dynamics | Asset composition evolves over time as new tokens become eligible, with rebalances on admission dates to achieve equal weighting. |
| Risk-free rate and currency | Returns are calculated in USD terms with a zero risk-free rate for Sharpe/Sortino unless otherwise noted. |
Results
Base case
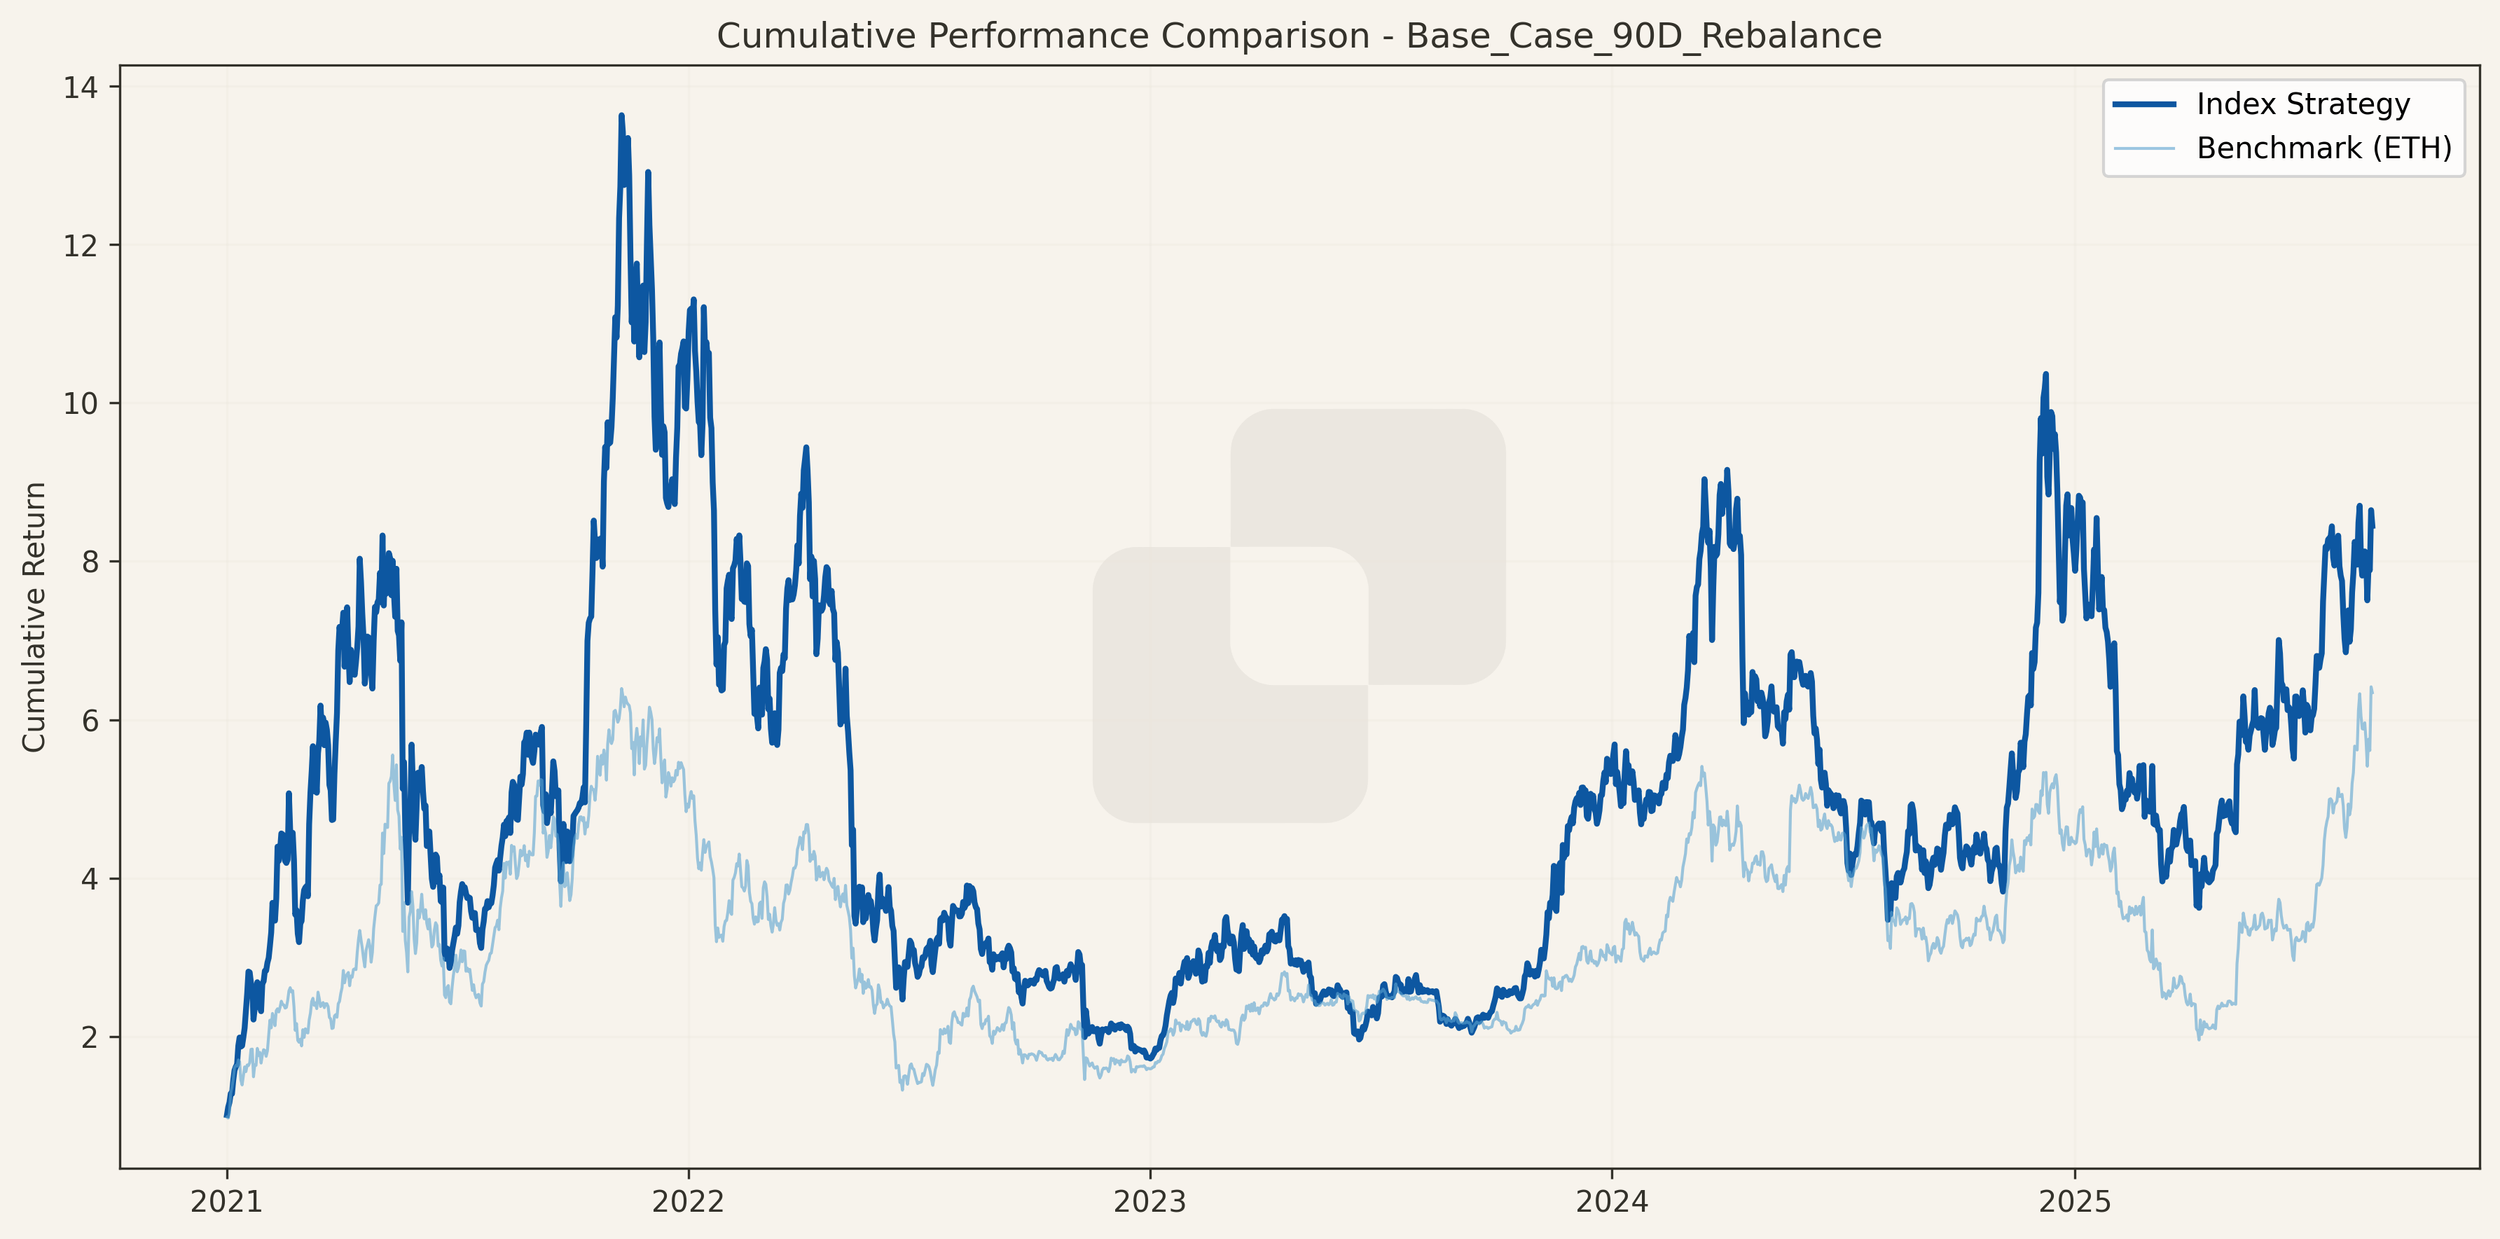
The base configuration compounds +744.92% total return against +487.07% for ETH across 1,697 trading days, translating to 37.29% vs 17.23% in annualised terms. This outperformance is visible in the cumulative curves, where the index maintains a persistent spread over the benchmark through multiple regimes.
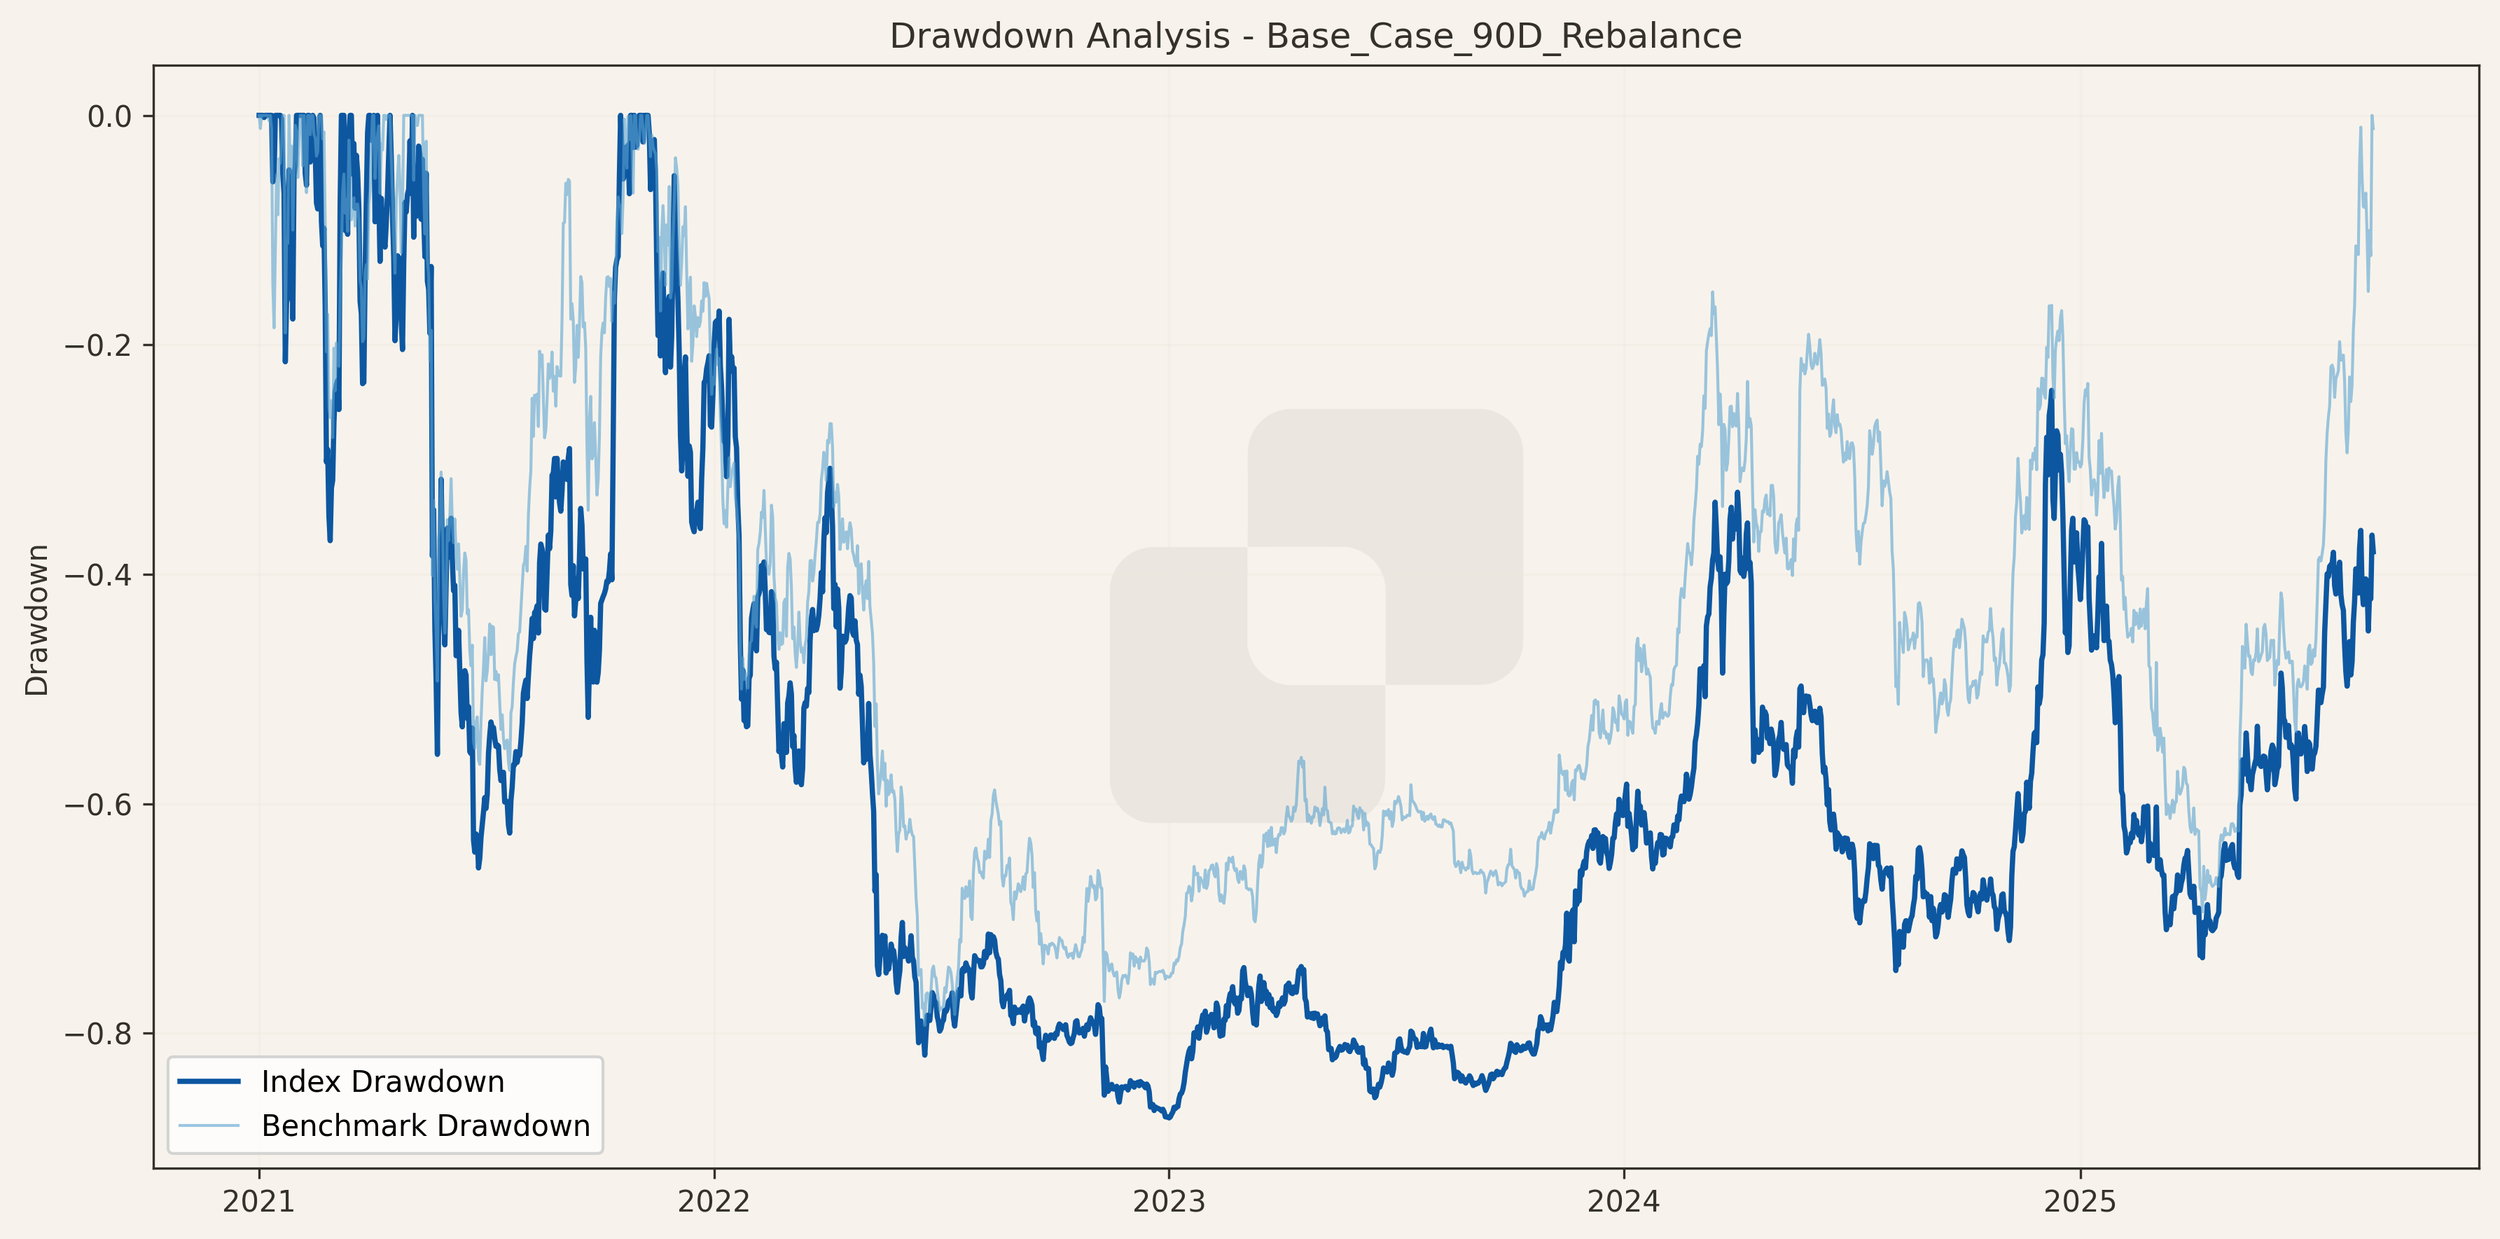
Risk is comparable to ETH and tolerable for a diversified DeFi basket: 76.42% annualised volatility versus 71.71% for the benchmark, with a maximum drawdown of −92.22% versus −87.37% for ETH. The drawdown plot shows shallower troughs in several cyclical sell-offs.
On a risk-adjusted basis, the index exhibits Sharpe 0.49, Sortino 0.70, Calmar 0.43 and Treynor 0.45, materially above ETH on each measure (0.24, 0.33, 0.18, 0.15). Relative performance diagnostics indicate β ≈ 0.78, information ratio 0.43, tracking error 46.82% and Jensen’s α ≈ +23.44%, implying excess return beyond simple ETH beta.
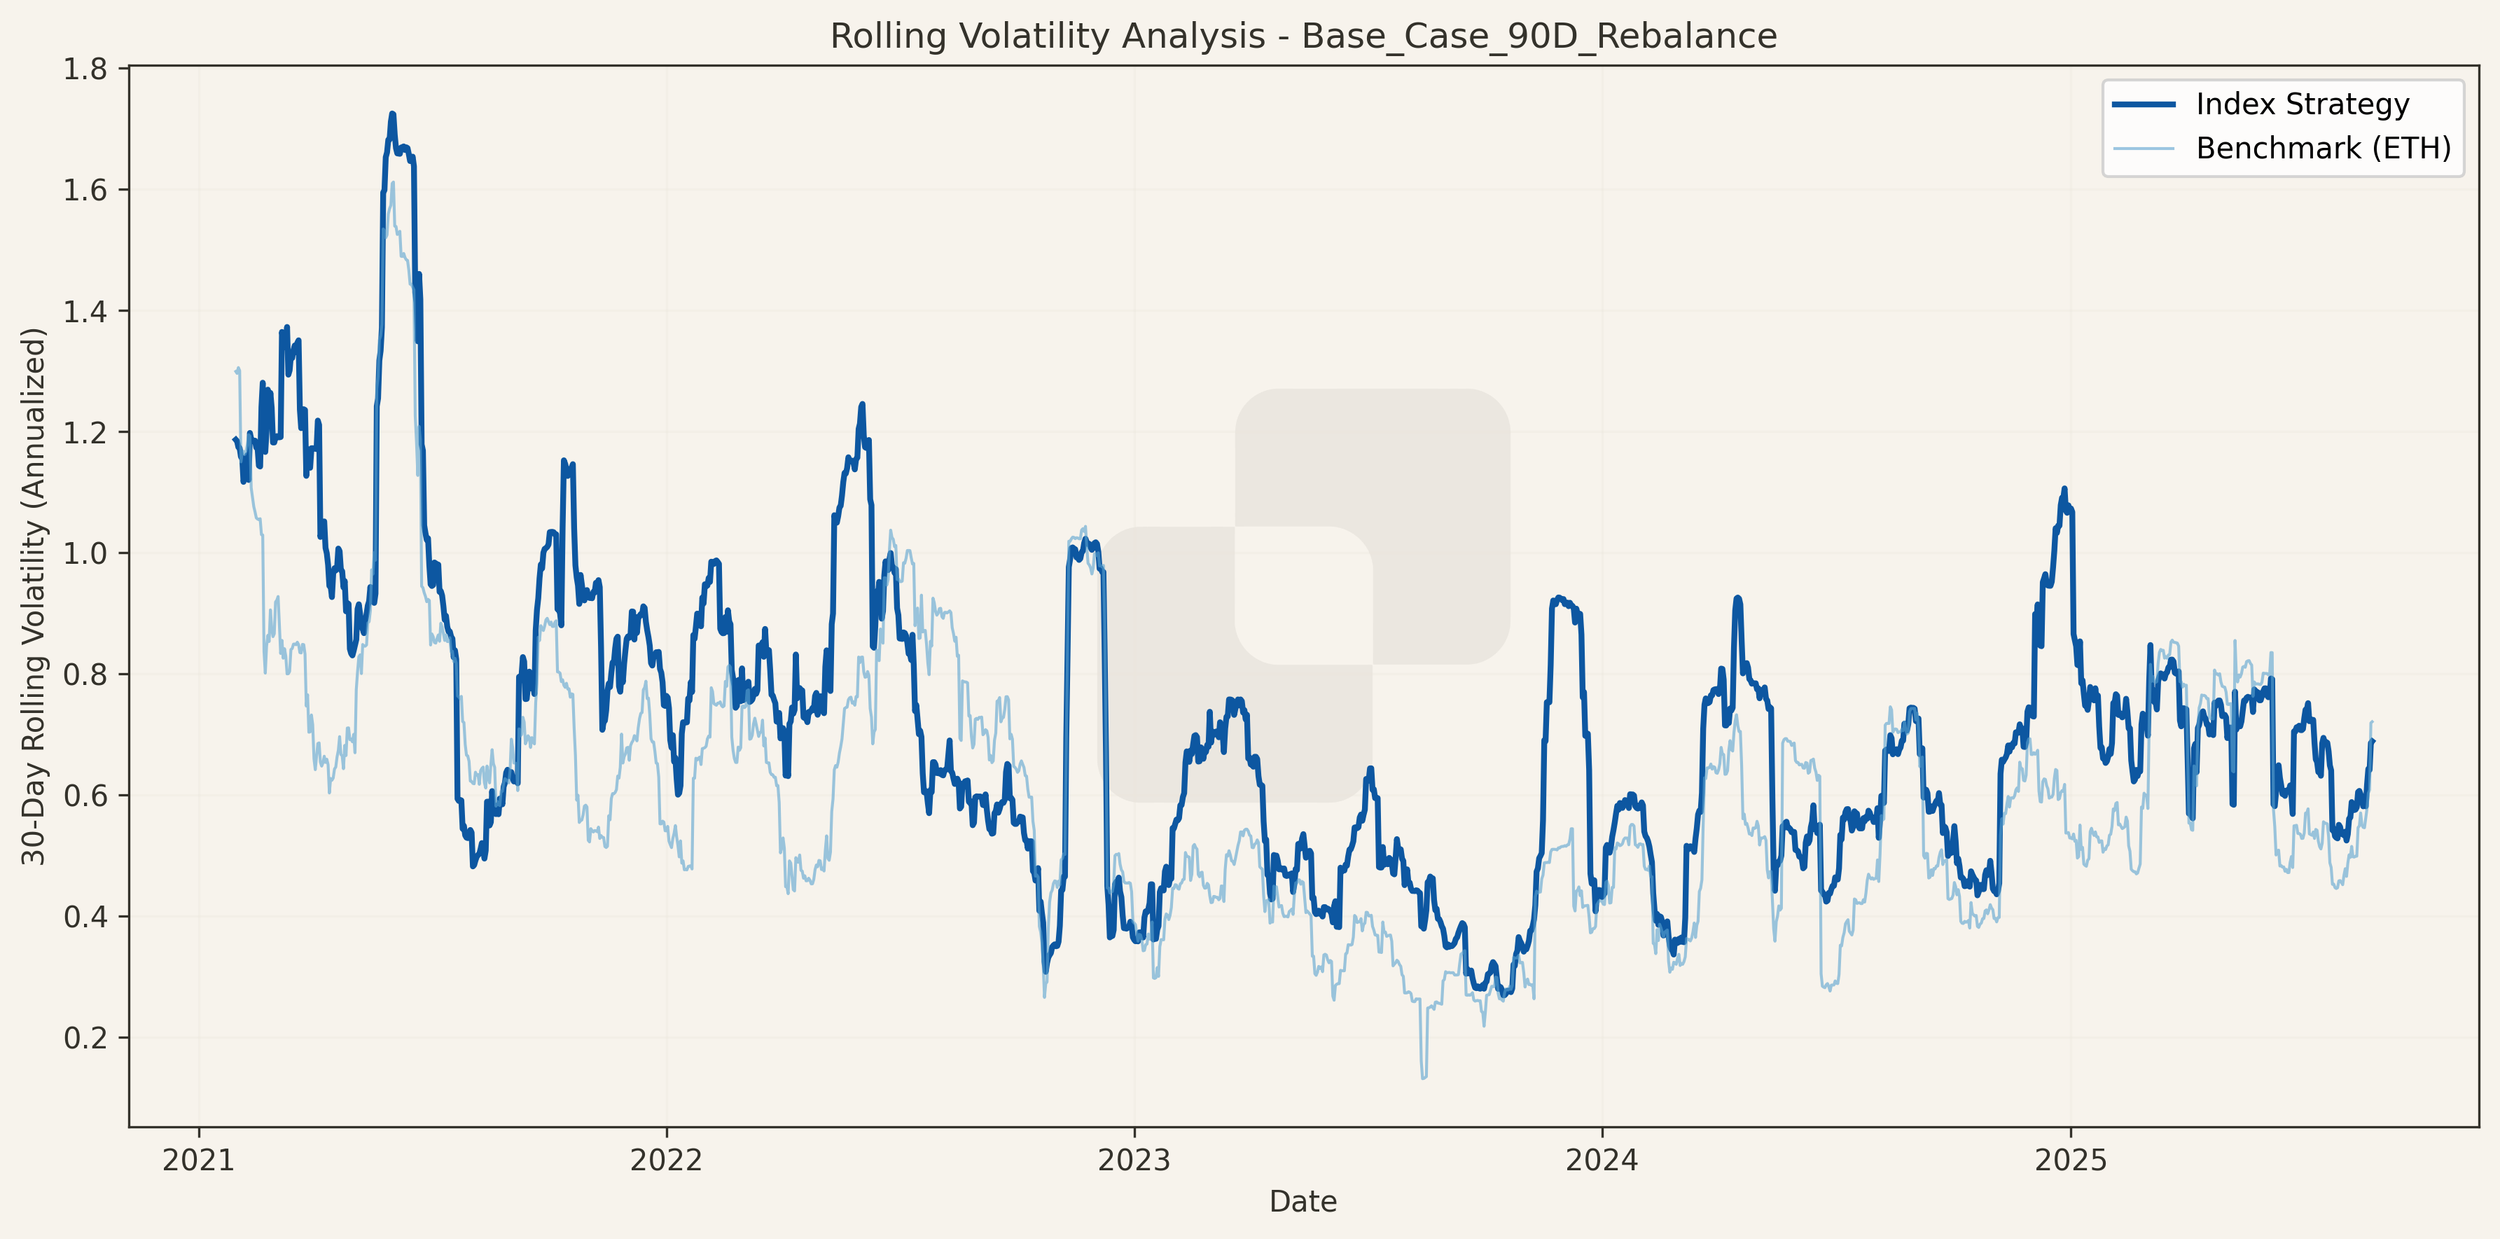
Short-horizon risk ebbs and flows with market cycles. The 30-day rolling volatility tends to sit marginally above ETH during expansions and compresses during calmer periods, consistent with broader factor exposure and rebalancing discipline.
Allocation drift is controlled by the bands and the composition rule. Weight trajectories show clustering of rebalances around listing dates and band breaches, with winners otherwise allowed to compound between quarterly resets.
Cumulative contribution is broad-based, with leadership from FXN (+82.39%), OGN (+62.73%), MKR/SKY (+50.97%), FRAX (+50.42%), CRV (+47.76%) and AAVE (+44.92%). LQTY (−10.01%) is the principal detractor over the window. This dispersion supports the thesis that a diversified, rules-based basket can monetise several distinct stablecoin-infrastructure profit pools simultaneously.
| Asset | Performance Attribution |
|---|---|
| MKR & SKY | 50.97% |
| RSR | 32.36% |
| FRAX | 50.42% |
| CRV | 47.76% |
| OGN | 62.73% |
| AAVE | 44.92% |
| INV | 31.89% |
| LQTY | -10.01% |
| FXN | 82.39% |
| ALCX | 5.14% |
Operationally, the engine executed 31 rebalancing events: 11 time-based, 5 composition changes, and the remainder driven by upper/lower band triggers. Activity was front-loaded as the universe expanded (2021: 12 events), normalising thereafter (2022: 5, 2023: 6, 2024: 5, 2025: 3 to date).
Optimising the rebalancing parameters
We evaluate rebalancing frequency and drift tolerance to balance two effects: (i) letting winners run (longer cycles, wider upper bands) and (ii) containing concentration and buying laggards (shorter cycles, higher floors). For comparability across combinations, we focus on Sharpe ratio as the primary metric.
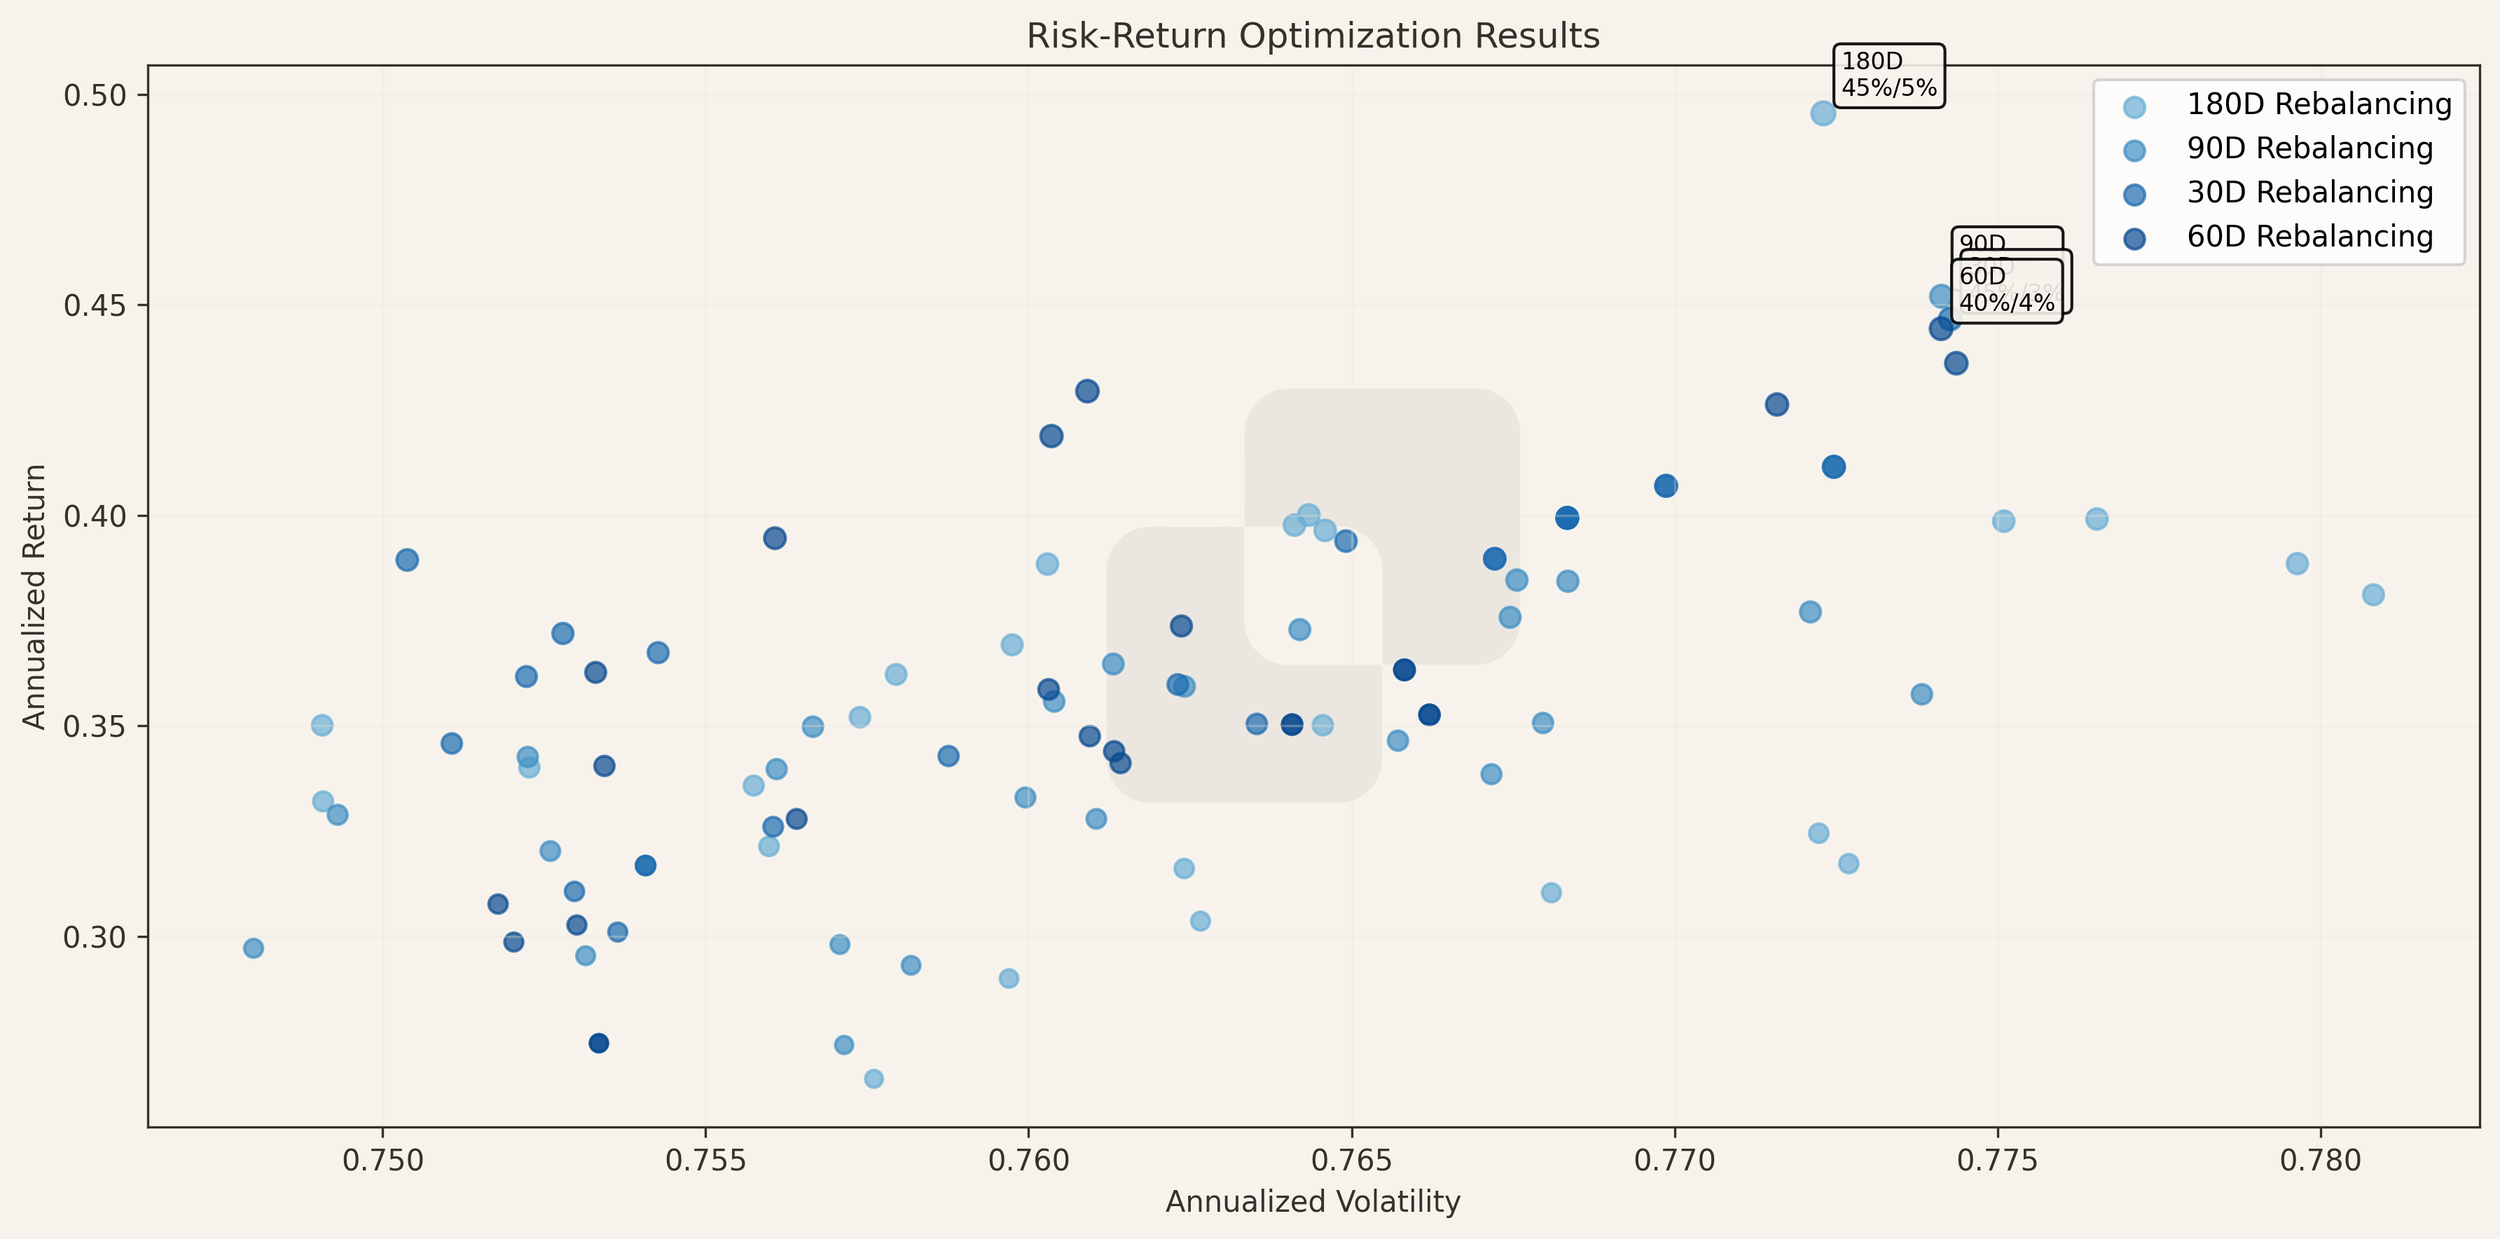
Across frequencies, the risk–return scatter shows the 180-day cluster on the efficient edge, delivering higher returns at similar volatility relative to shorter cadences.
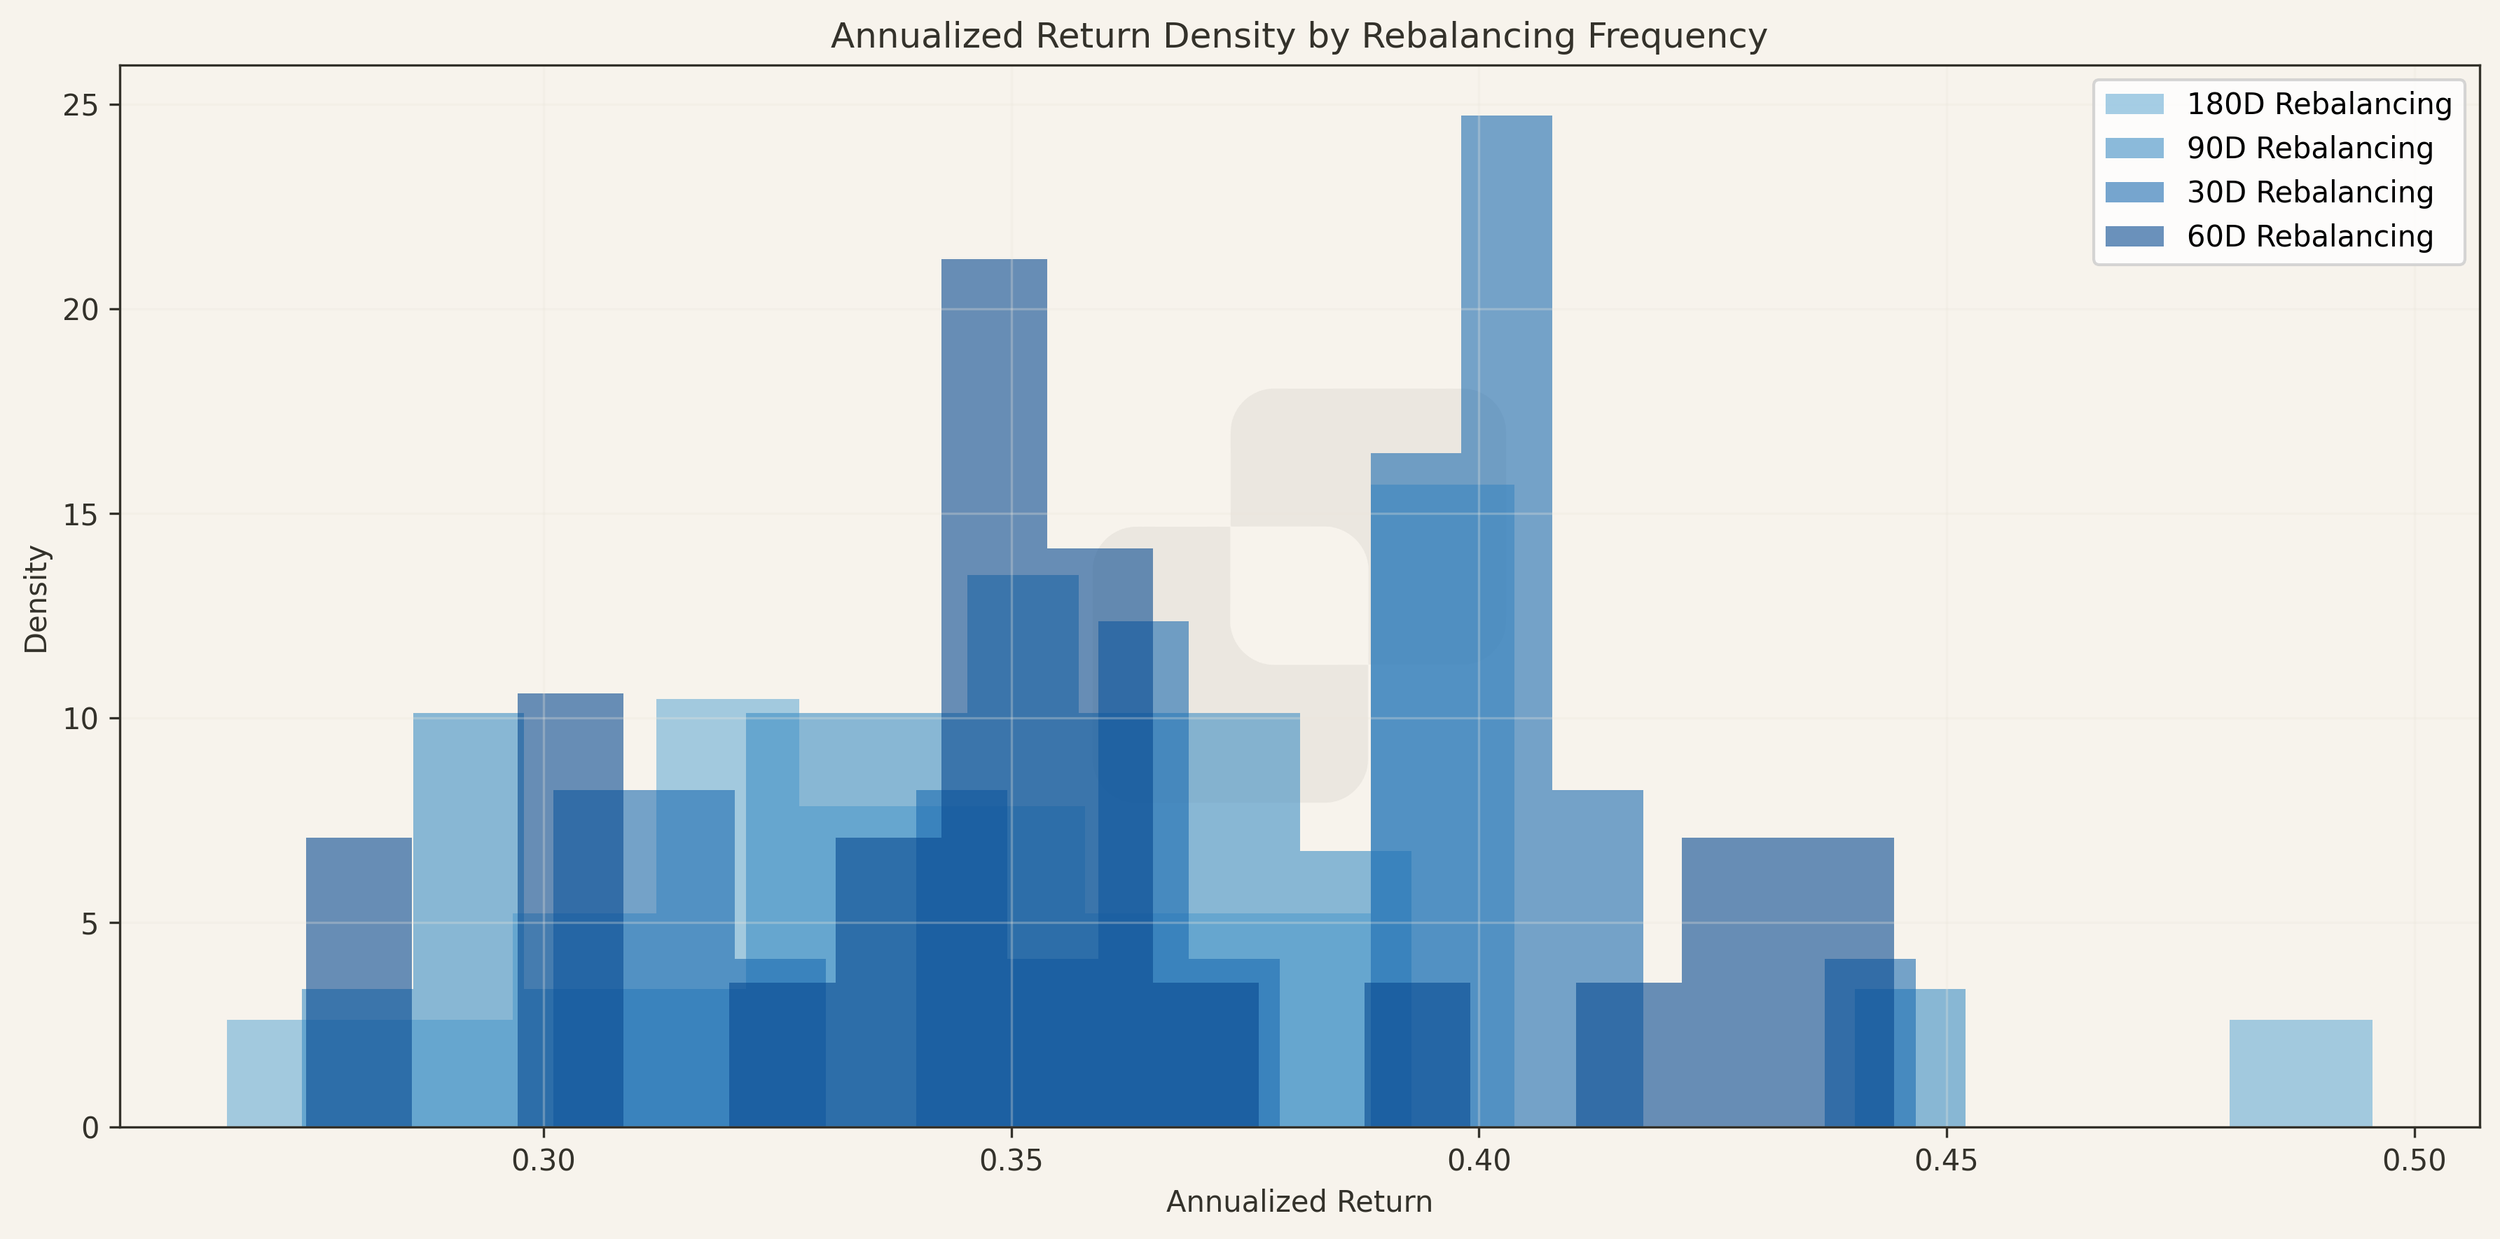
Distributionally, annualised return densities shift upward for 180-day schedules, with a fatter right tail; 30-day schedules compress lower with thicker left tails, consistent with over-trading and premature trimming of trends.
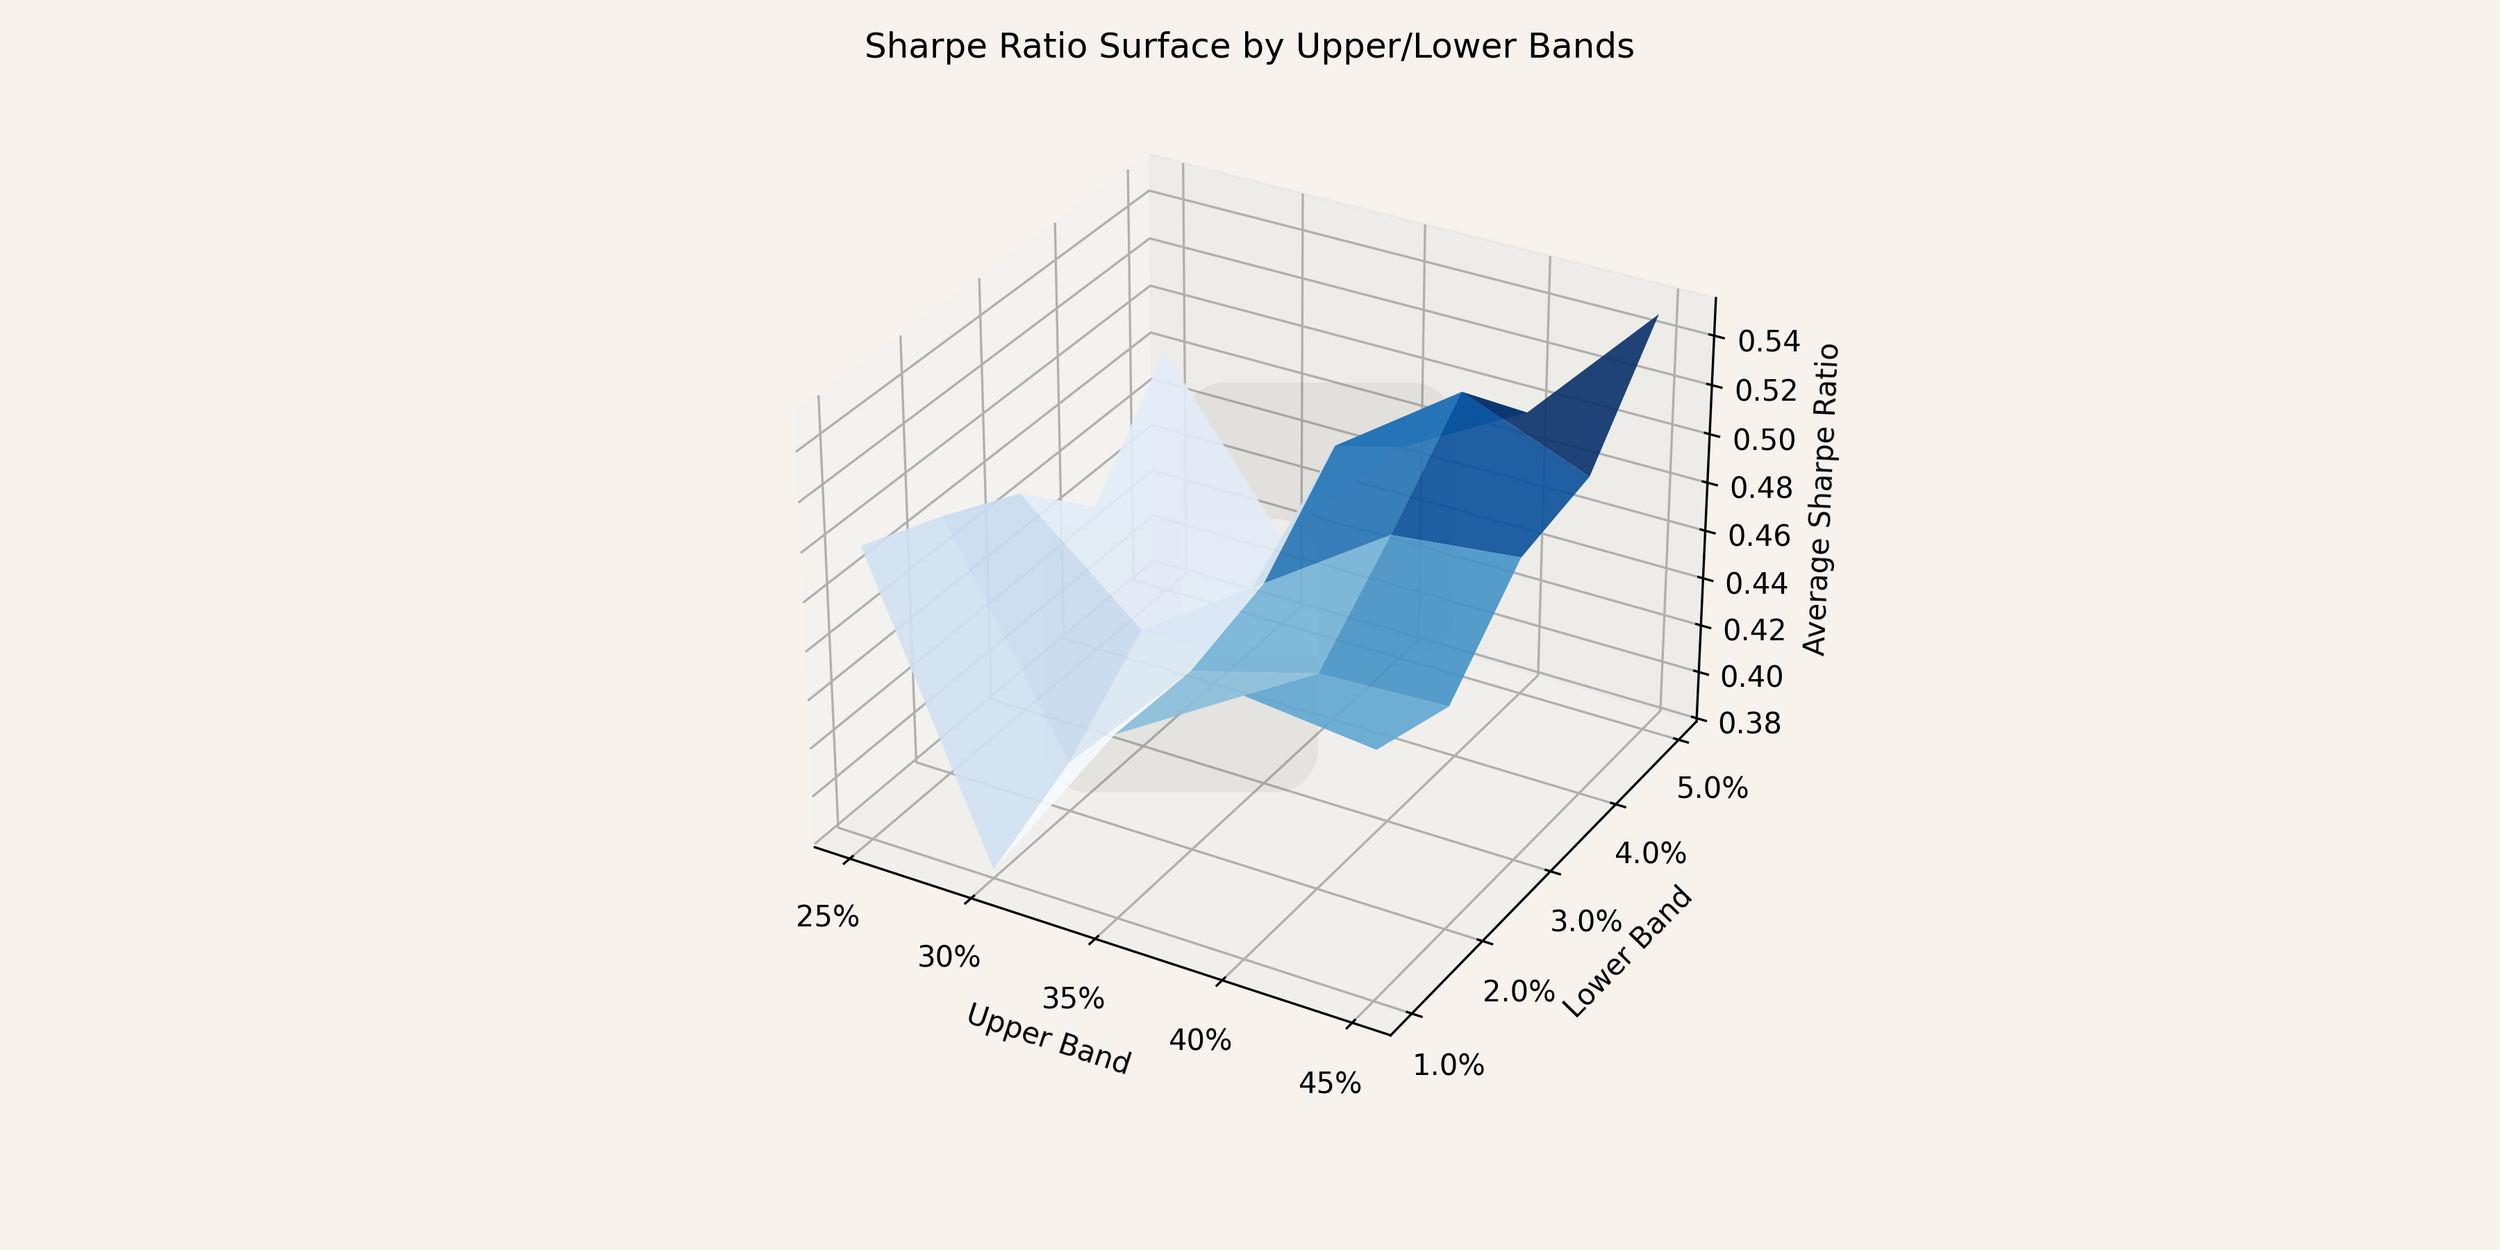
The Sharpe surface over band pairs slopes upward towards wider upper bands (≈40–45%) and higher floors (≈5%), indicating that moderate drift coupled with a protective lower bound improves risk-adjusted outcomes by avoiding small, inactive tail positions while not cutting winners.
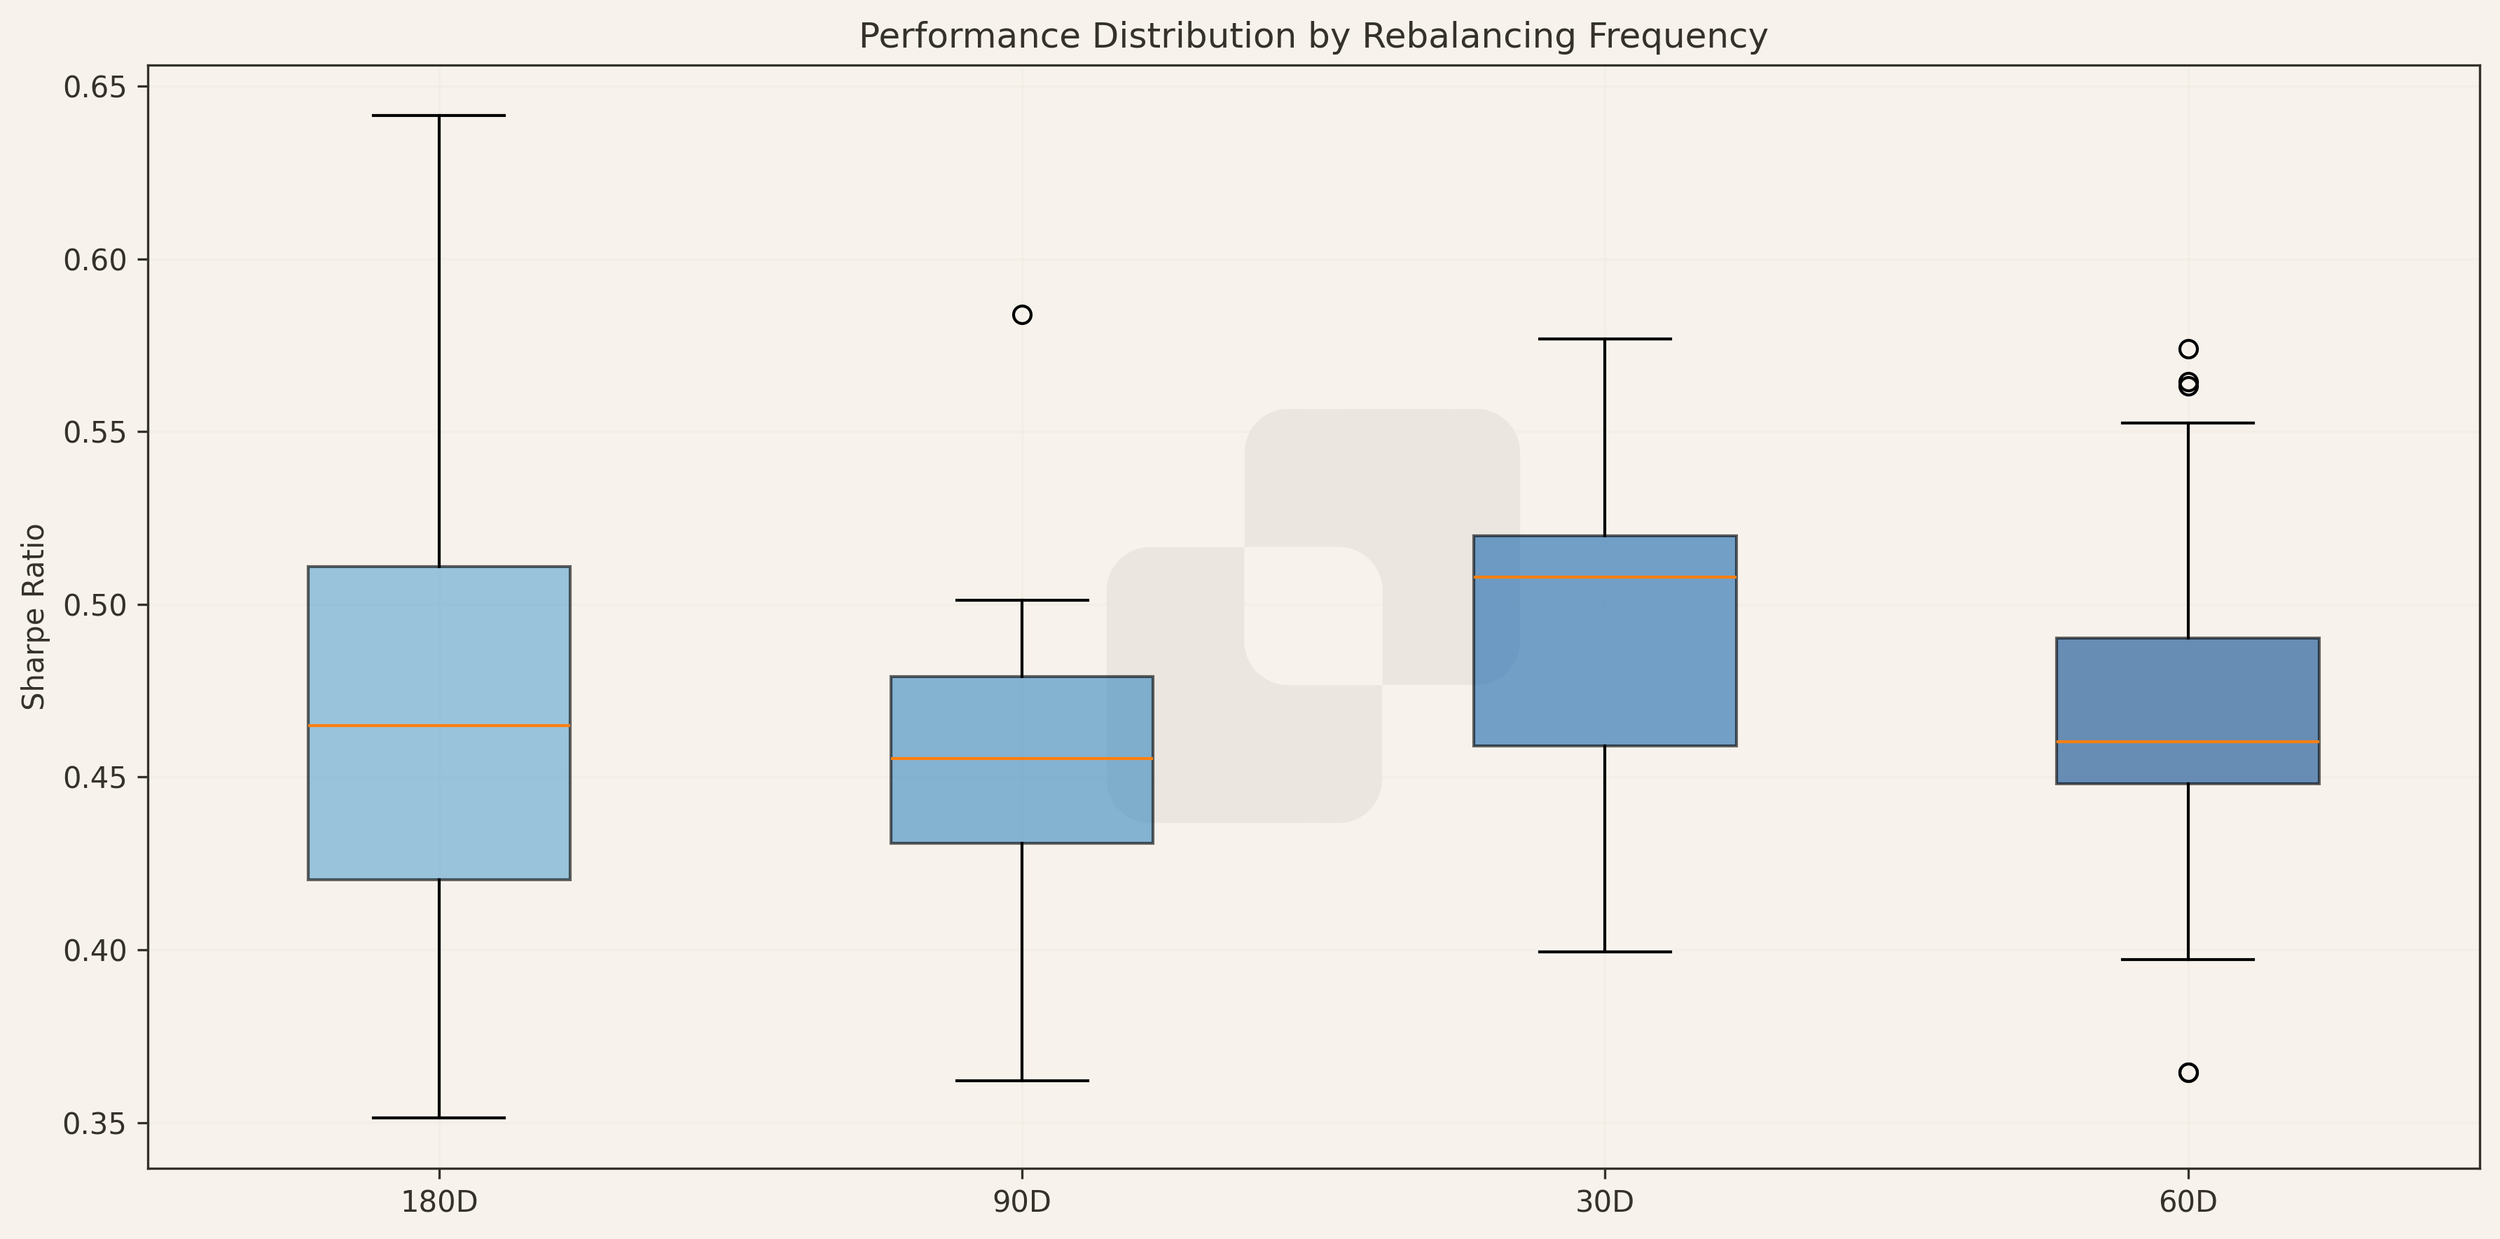
Sharpe boxplots by frequency confirm these findings: 180-day schedules generate the strongest maxima with competitive medians; 60/90-day sit in the middle; 30-day displays the widest dispersion.
The grid search identifies a clear best configuration: 180D with upper band 45% and lower band 5%, achieving Sharpe ≈ 0.642 and annualised return ≈ 49.55%, with volatility ~0.77 and max drawdown ~−0.84. The next best combinations include 90D (45%/5%), 30D (45%/3%) and 60D (40%/4%), all trailing the 180D winner but markedly ahead of tighter-band settings.
Conclusion
The base configuration already achieves substantial excess return over ETH with meaningfully stronger risk-adjusted performance (higher Sharpe/Sortino/Calmar and positive α with β < 1), validating a diversified, equal-weight design for stablecoin-infrastructure exposure. Drawdowns remain crypto-native, but are deeper than ETH over major sell-offs, and turnover is tractable with events clustering around genuine information (listings and band breaches).
Starting the strategy earlier would have captured multiple, distinct profit centres, issuers, money markets, stablecoin DEX liquidity and incentive flywheels, evidenced by broad-based attribution with several leaders and only one clear laggard. This supports the view that a rules-based basket can harvest thematically aligned, yet imperfectly correlated, return streams.
Optimisation suggests longer rebalancing cycles with wider upper bands and a modest floor (≈5%) deliver the best risk–return trade-off. Practically, that means fewer forced sales, more trend capture, and less capital trapped in micro-weights, at the cost of somewhat higher interim concentration and the risk of overshooting before a reset. If live operations tolerate slightly more drift, moving towards 180D / 45% / 5% is defensible; otherwise, the current 90D cadence remains a robust middle-ground with strong performance and more frequent alignment to target weights.
Next steps include modelling execution frictions (gas/slippage), refining data quality (exchange-weighted OHLCV, staleness checks), and testing a frozen-universe variant to bound listing bias. A complementary benchmark set (e.g., alternative DeFi indices or TVL-weighted baskets) and optional overlays (volatility-targeting or drawdown clamps) can further tailor the product to live constraints.
This article may contain material that is not directed to, or intended for distribution to or use by, any person or entity who is a citizen or resident of or located in any locality, state, country or other jurisdiction where such distribution, publication, availability or use would be contrary to law or regulation or which would subject 512m AG or its affiliates to any registration or licensing requirement within such jurisdiction. The information, tools and material presented in this article are provided to you for information purposes only and are not to be used or considered as an offer or the solicitation of an offer to sell or to buy or subscribe for securities or other financial instruments.